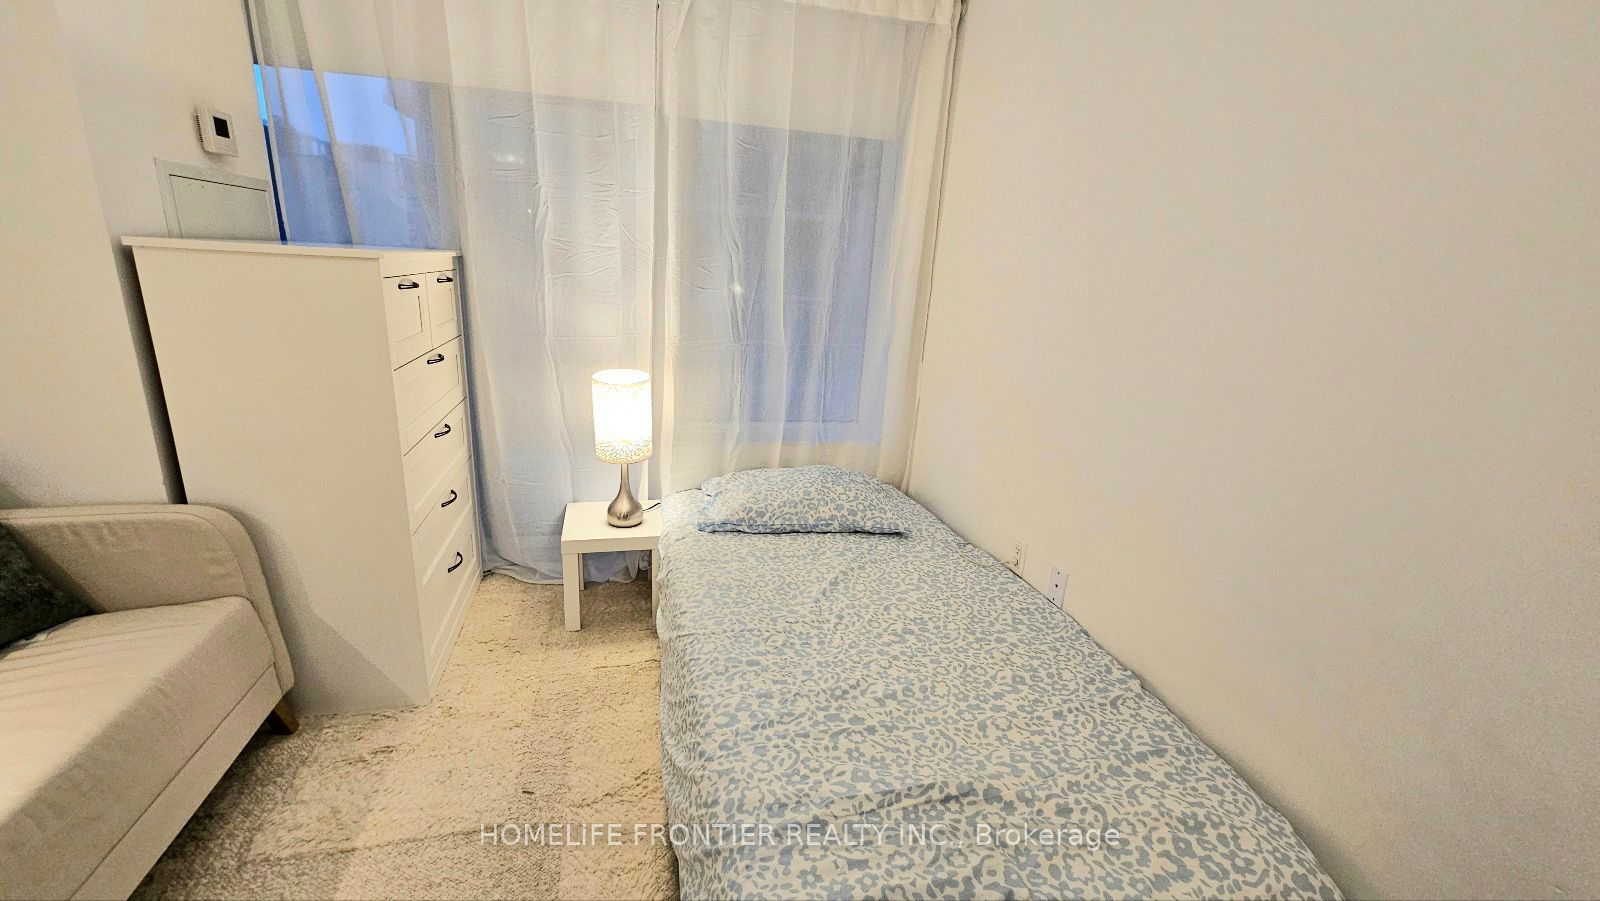
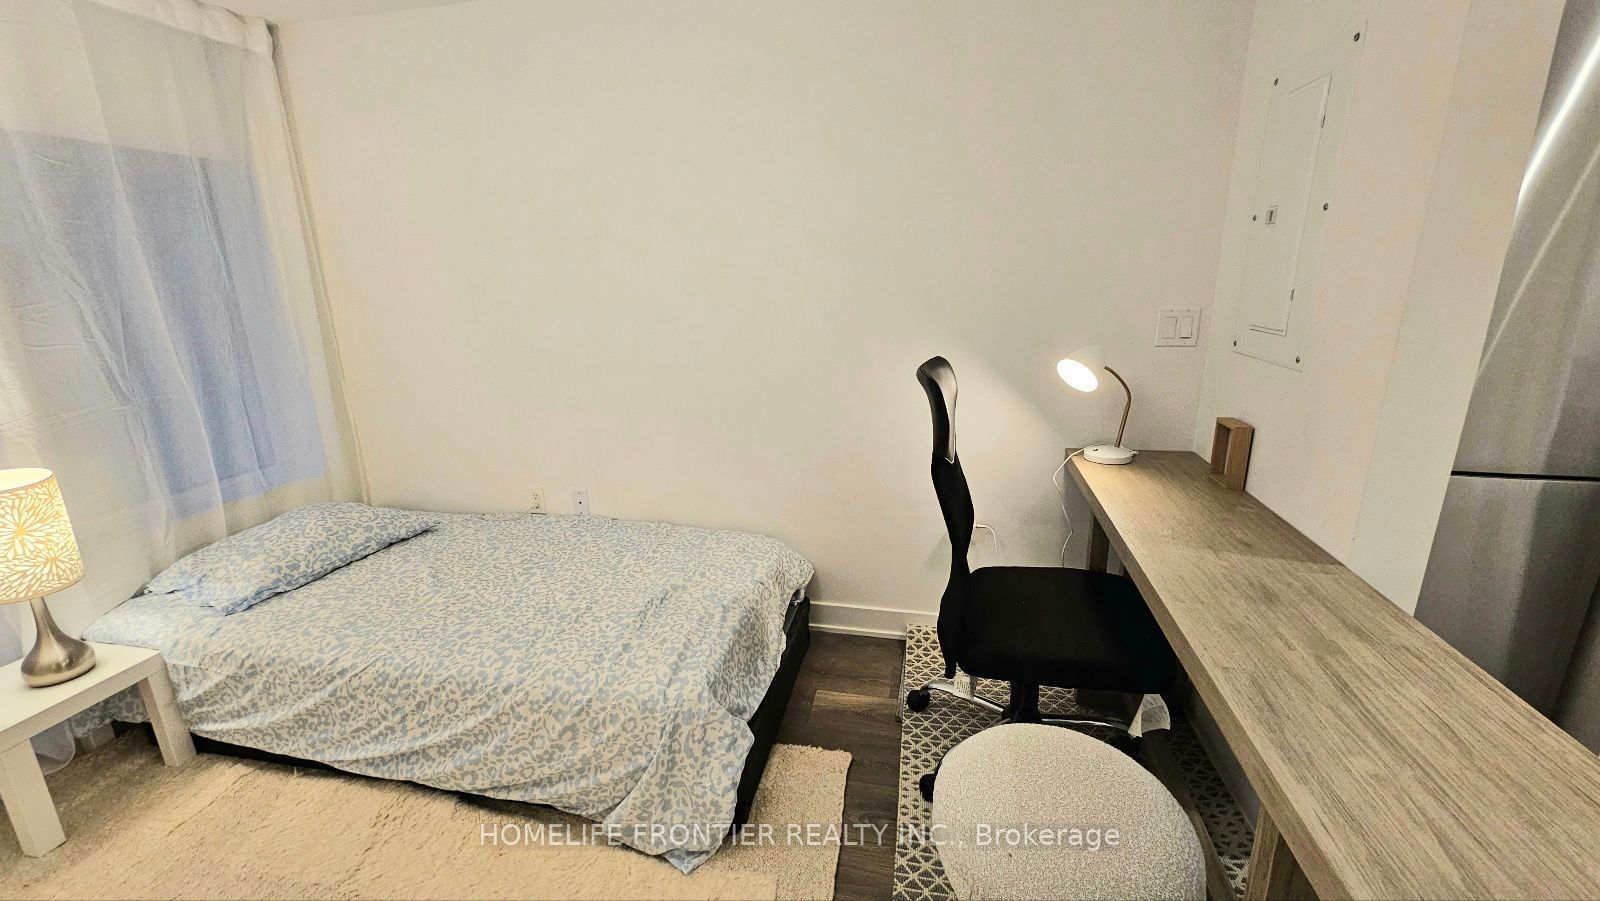
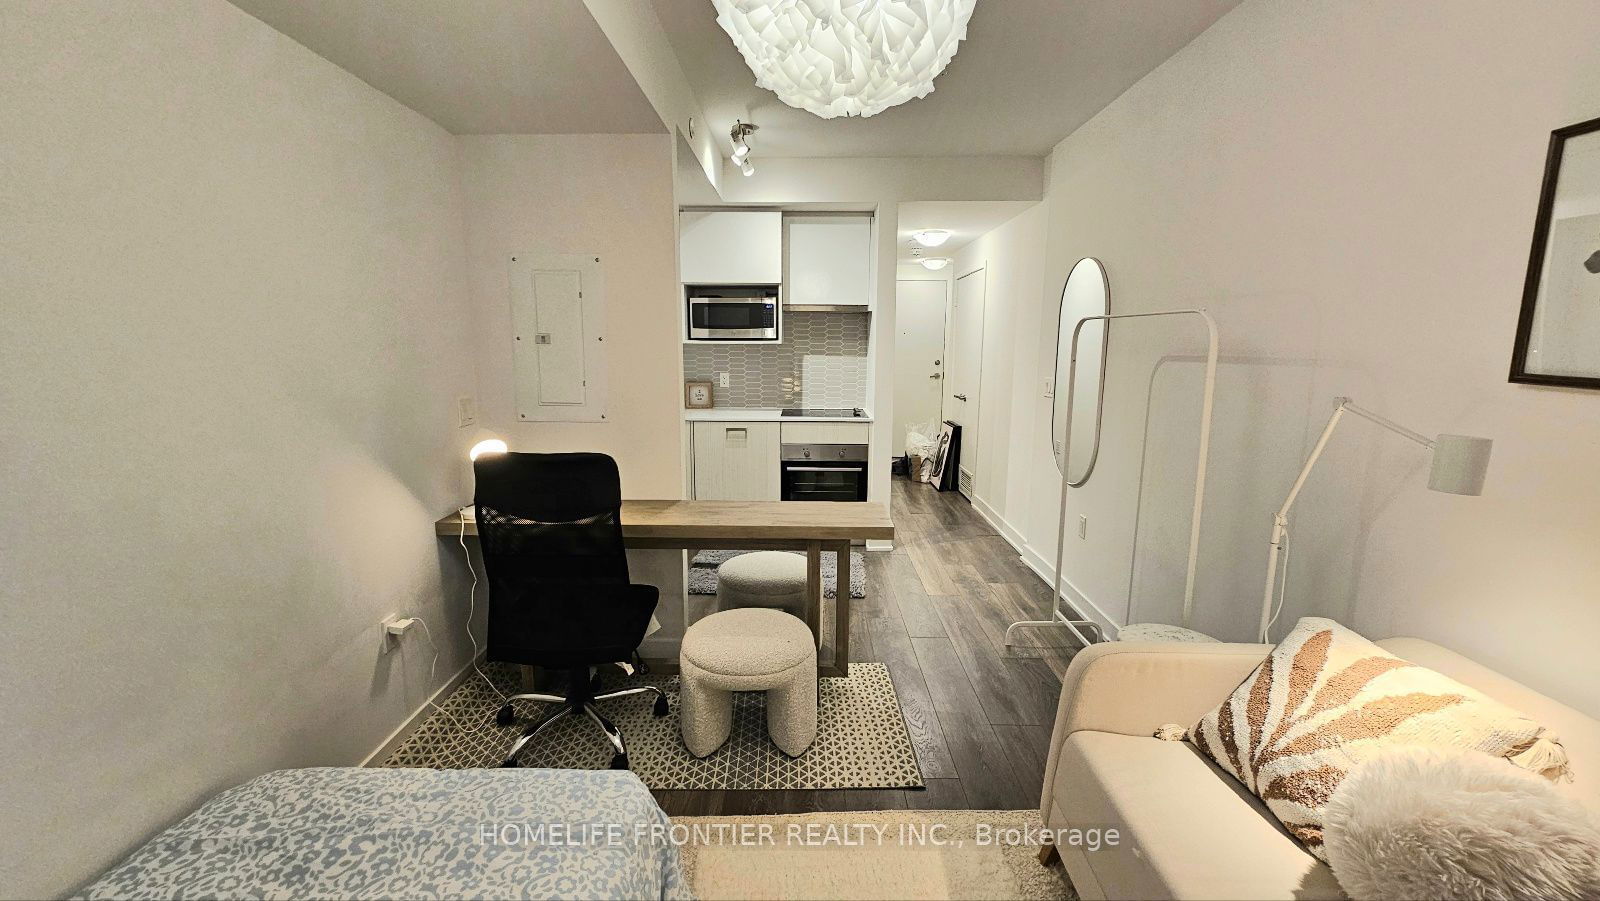
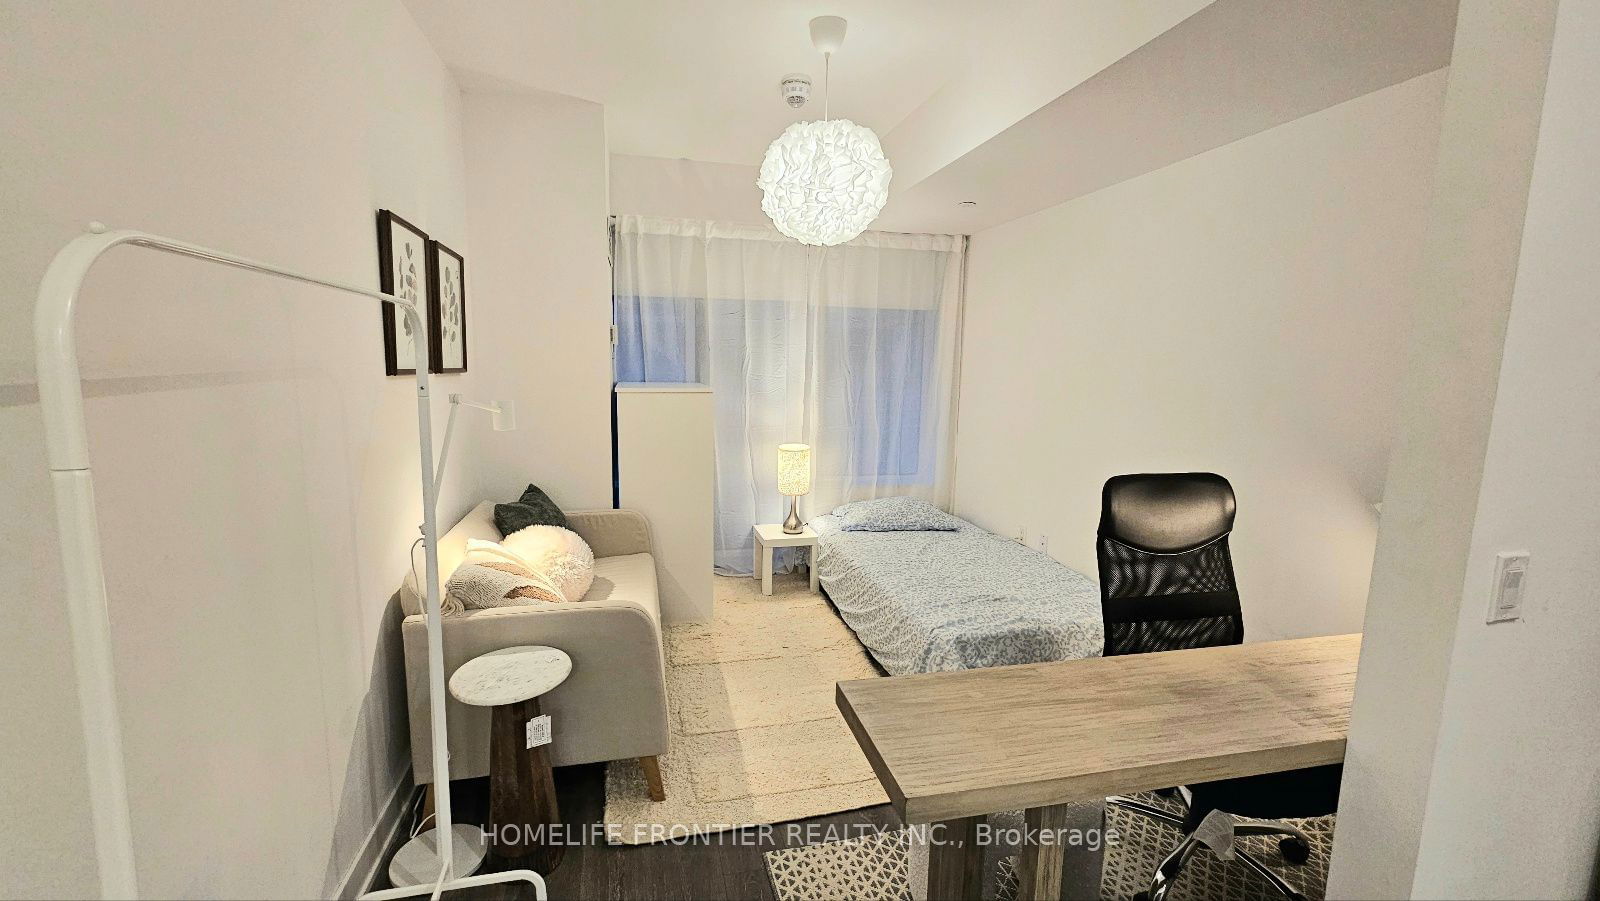
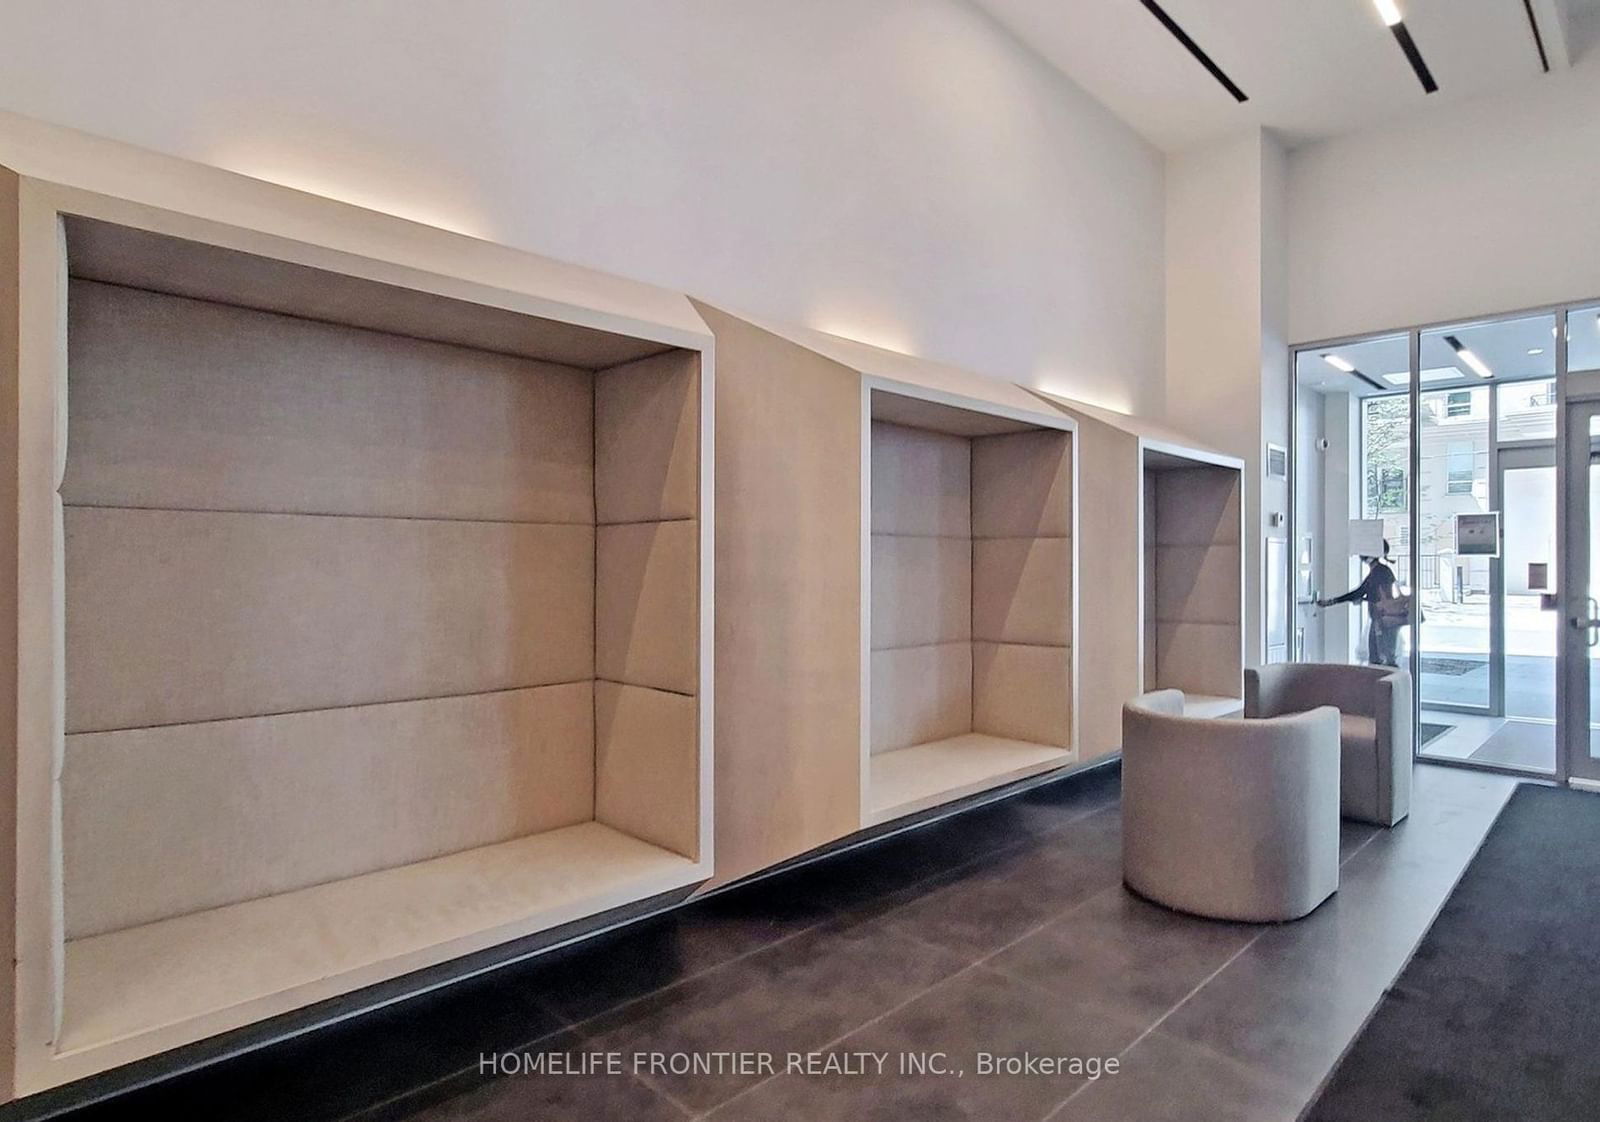
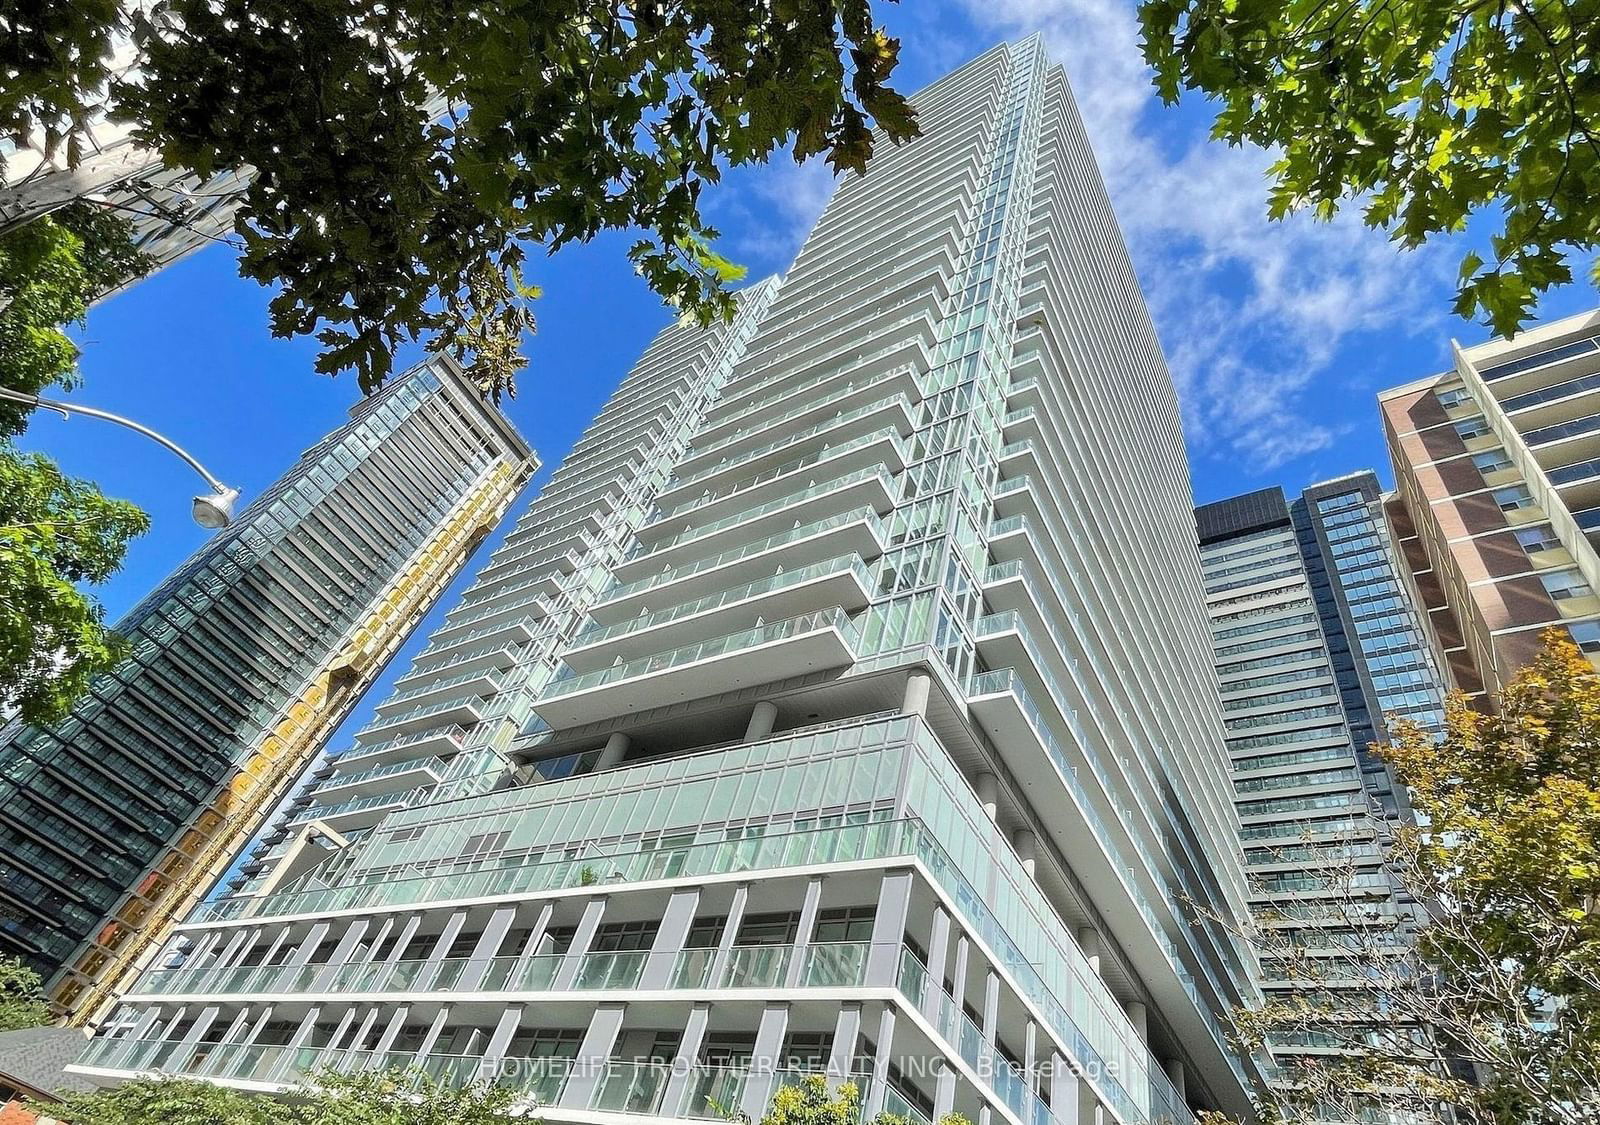
1414 - 195 Redpath Ave
Listing History
Unit Highlights
Maintenance Fees
Utility Type
- Air Conditioning
- Central Air
- Heat Source
- Gas
- Heating
- Forced Air
Room Dimensions
About this Listing
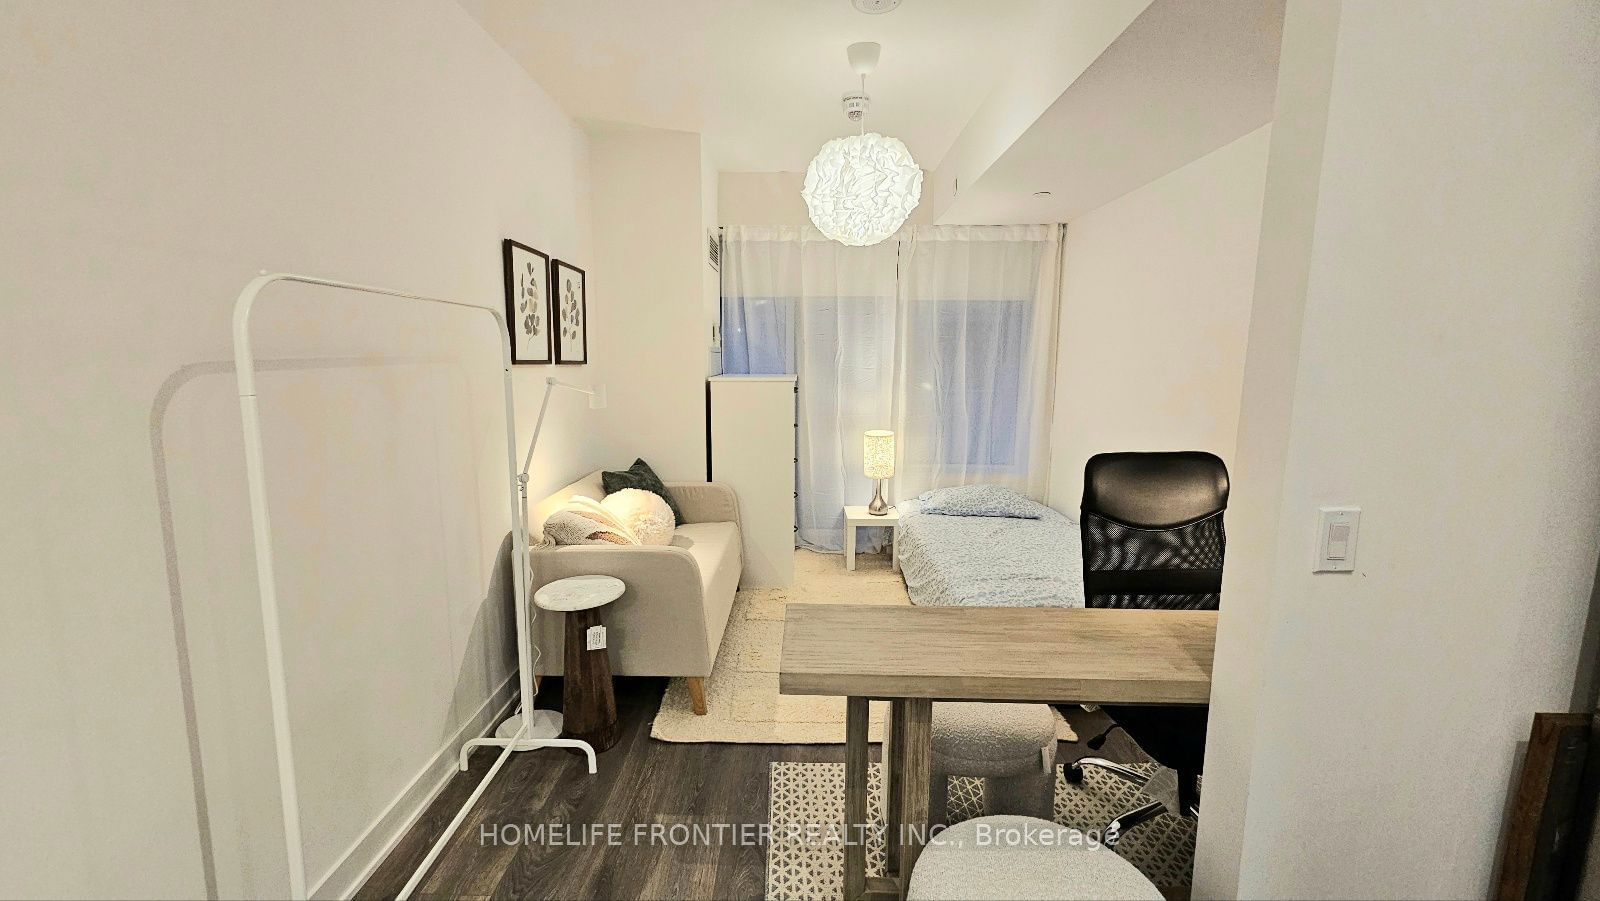
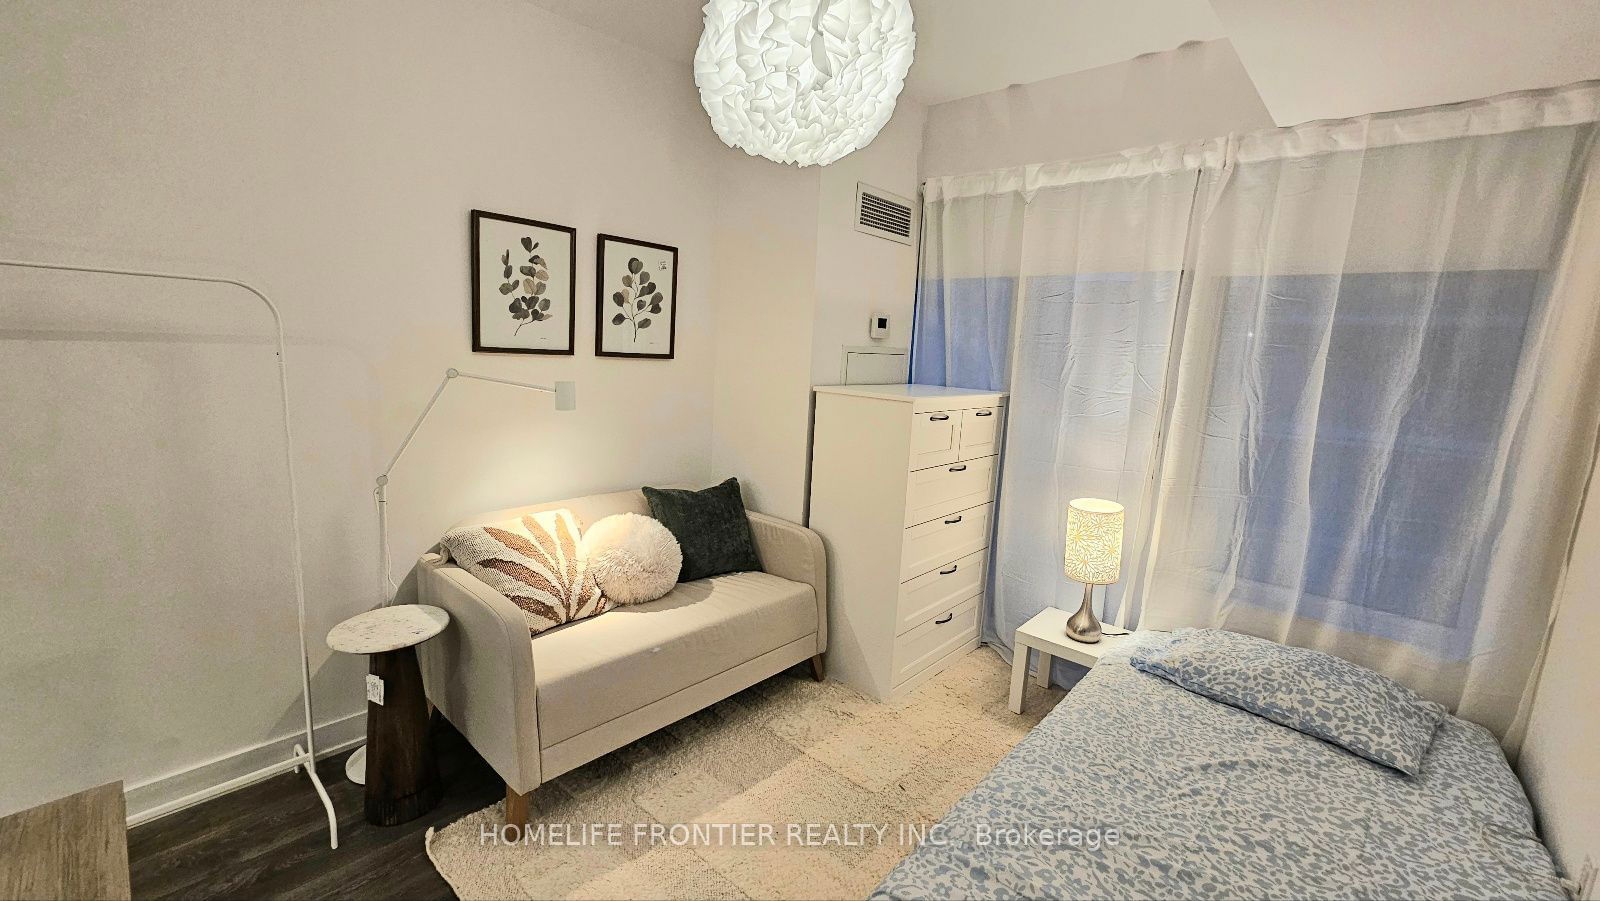
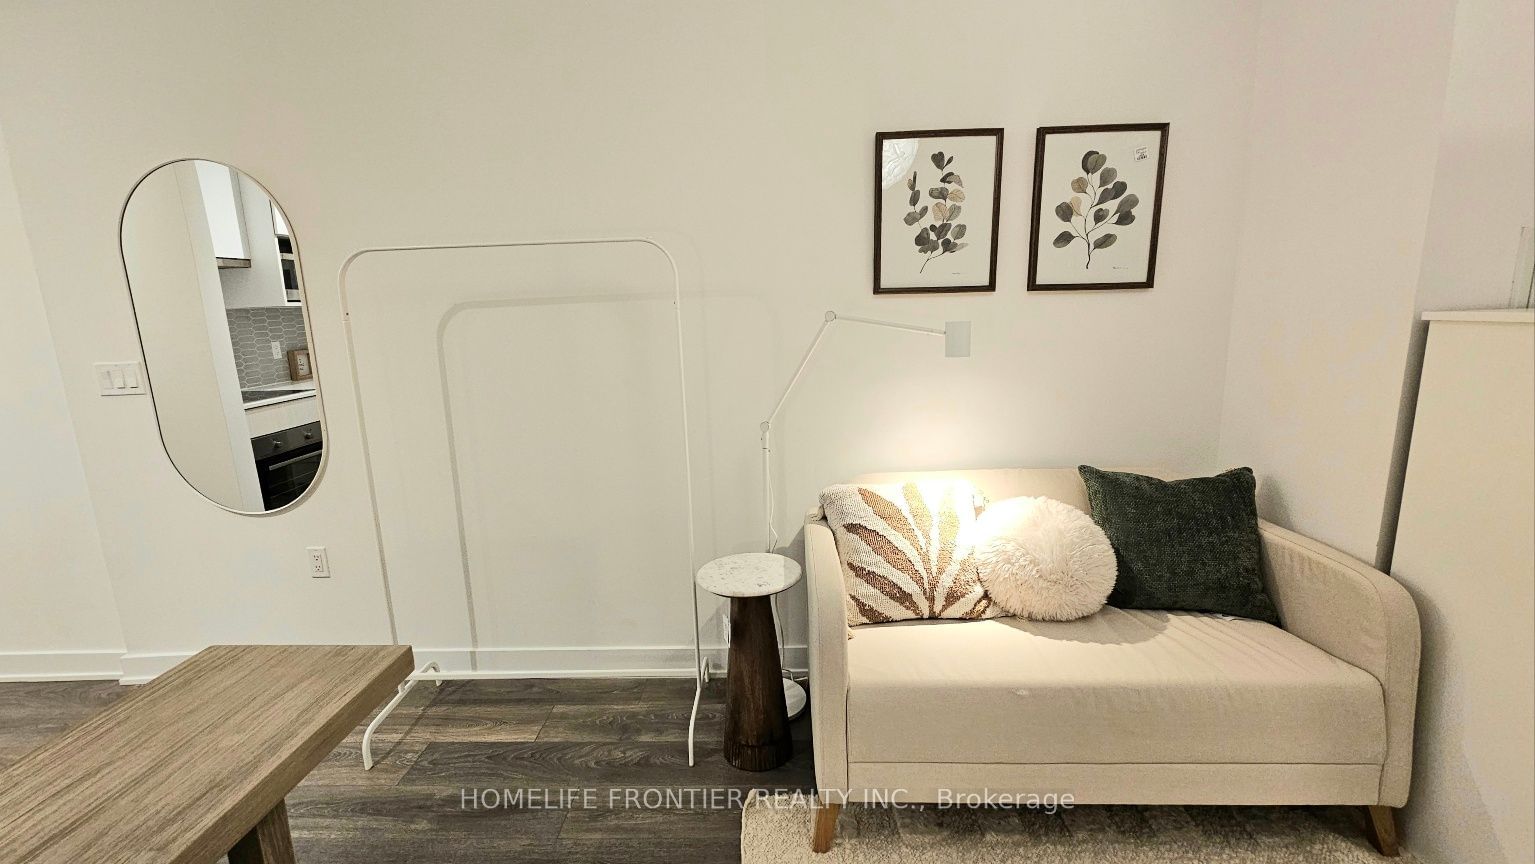
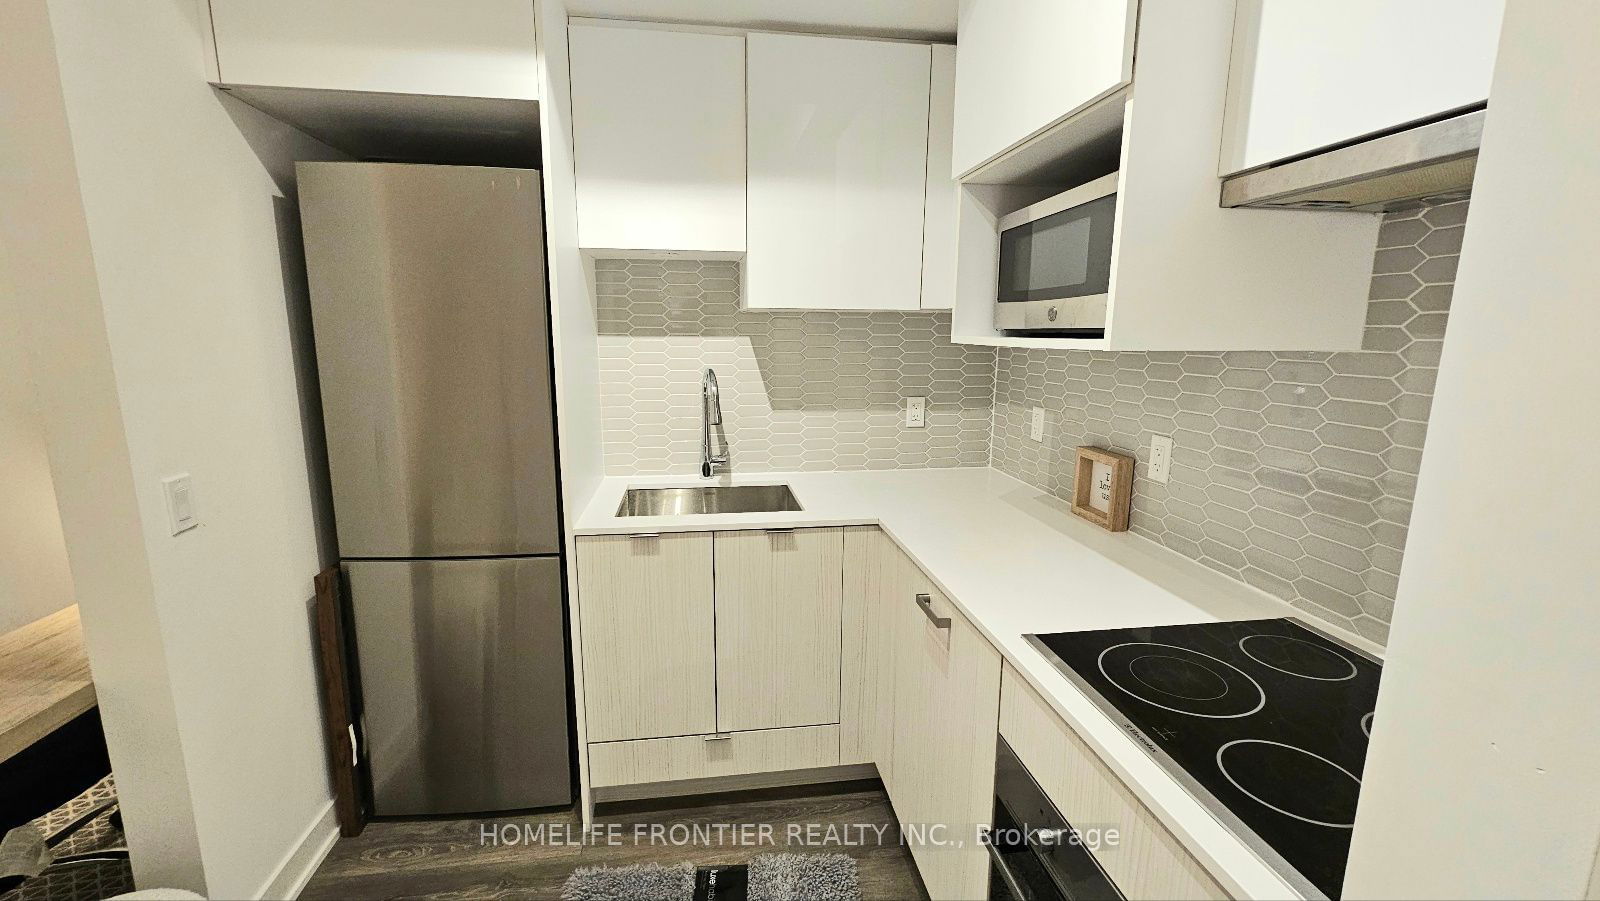
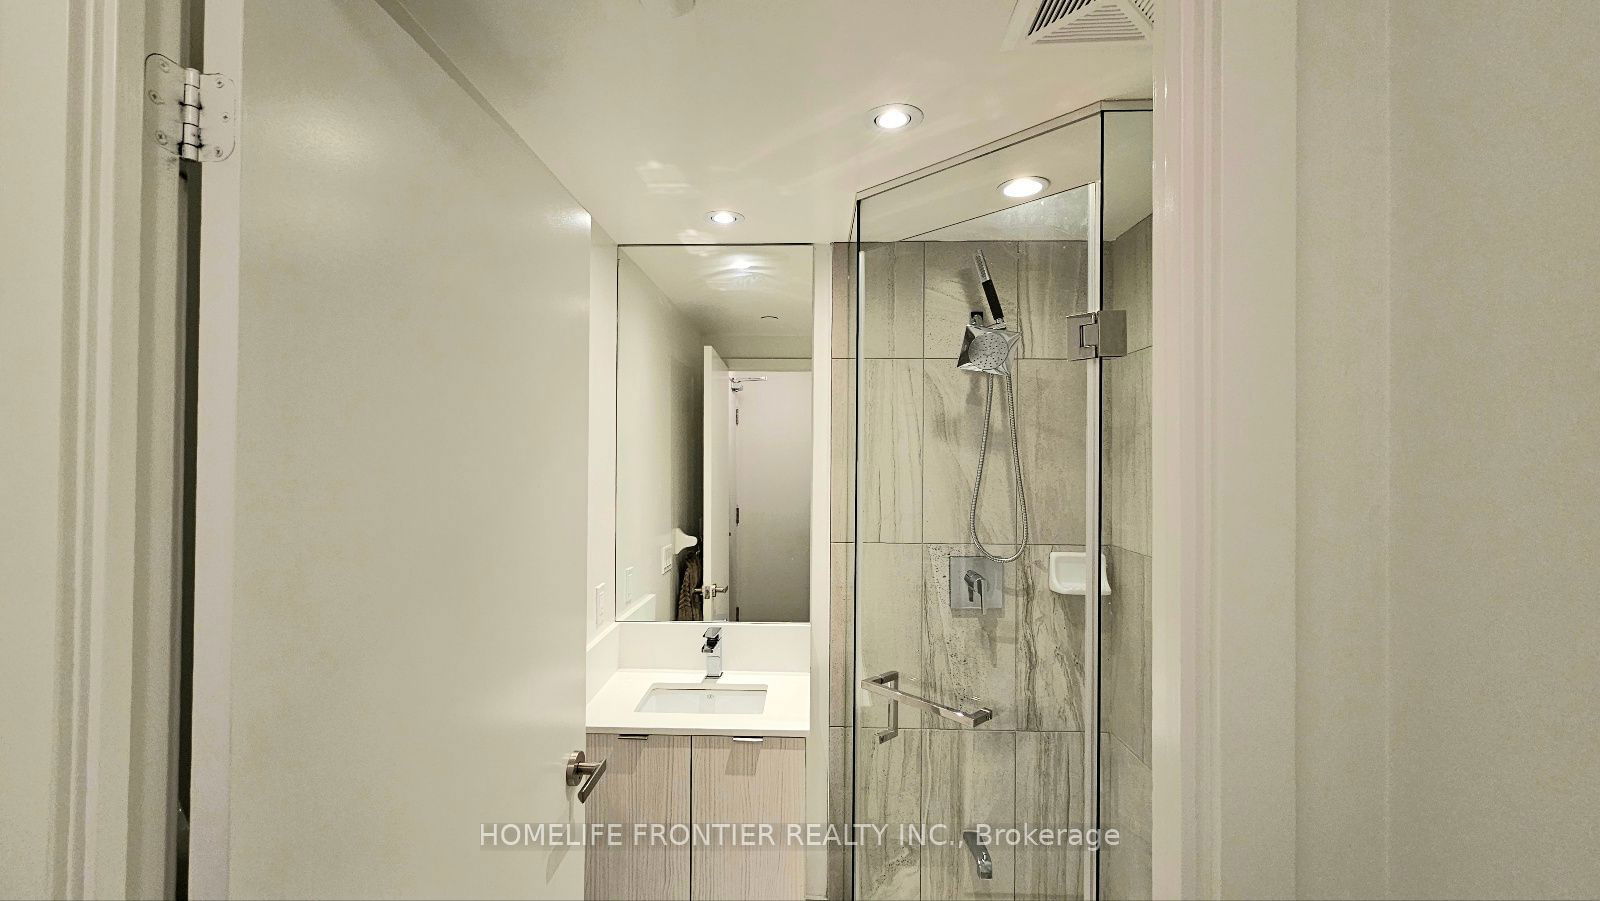
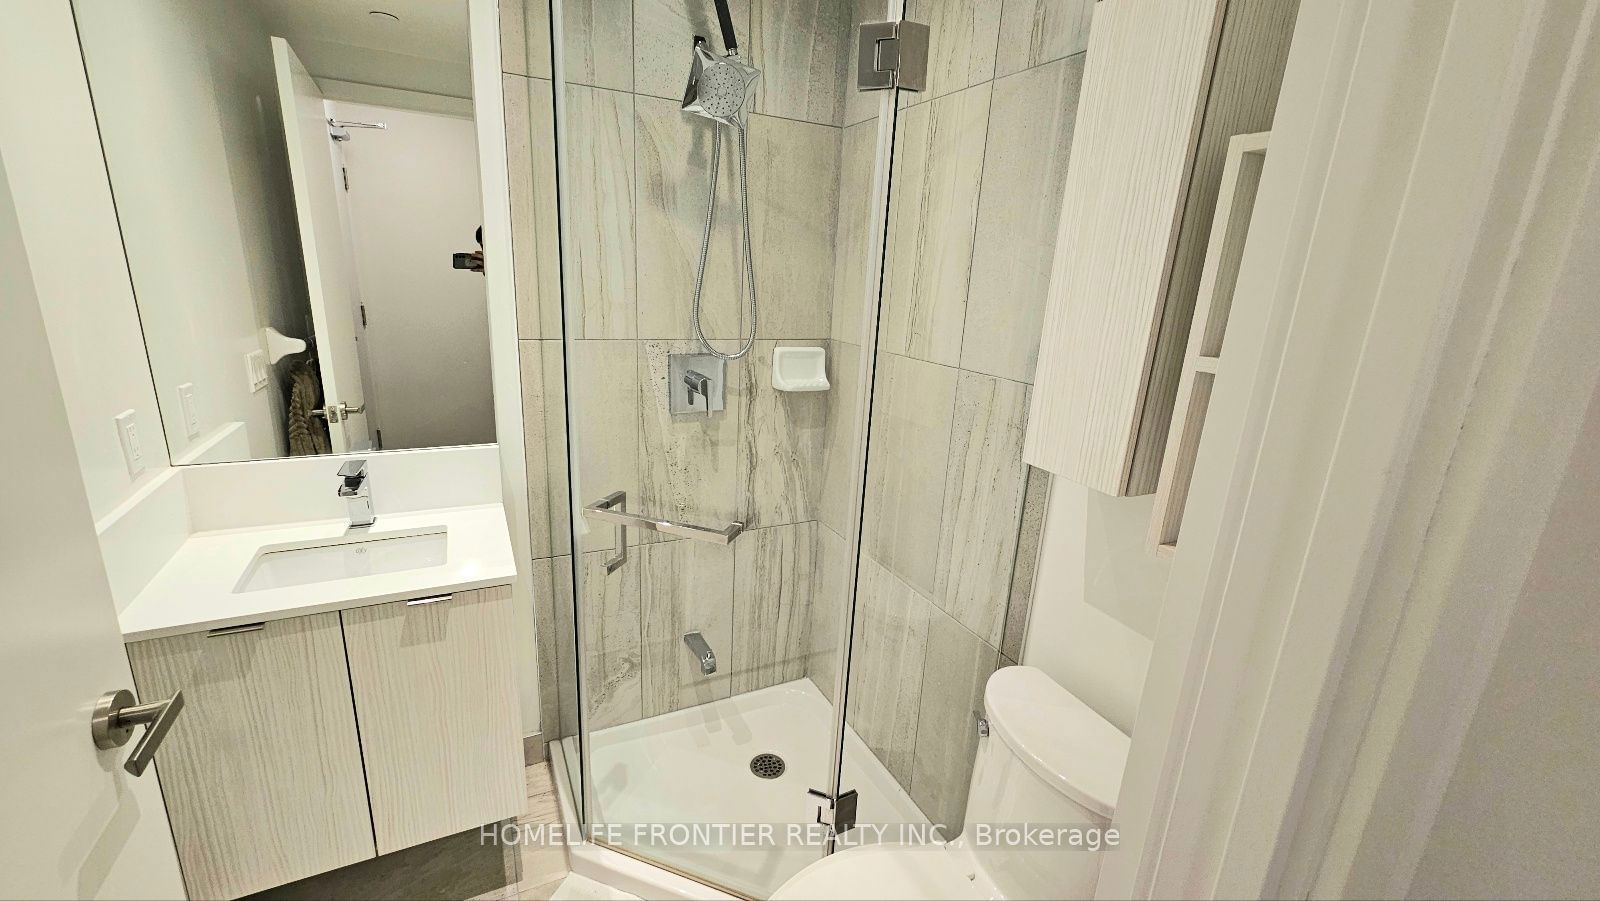
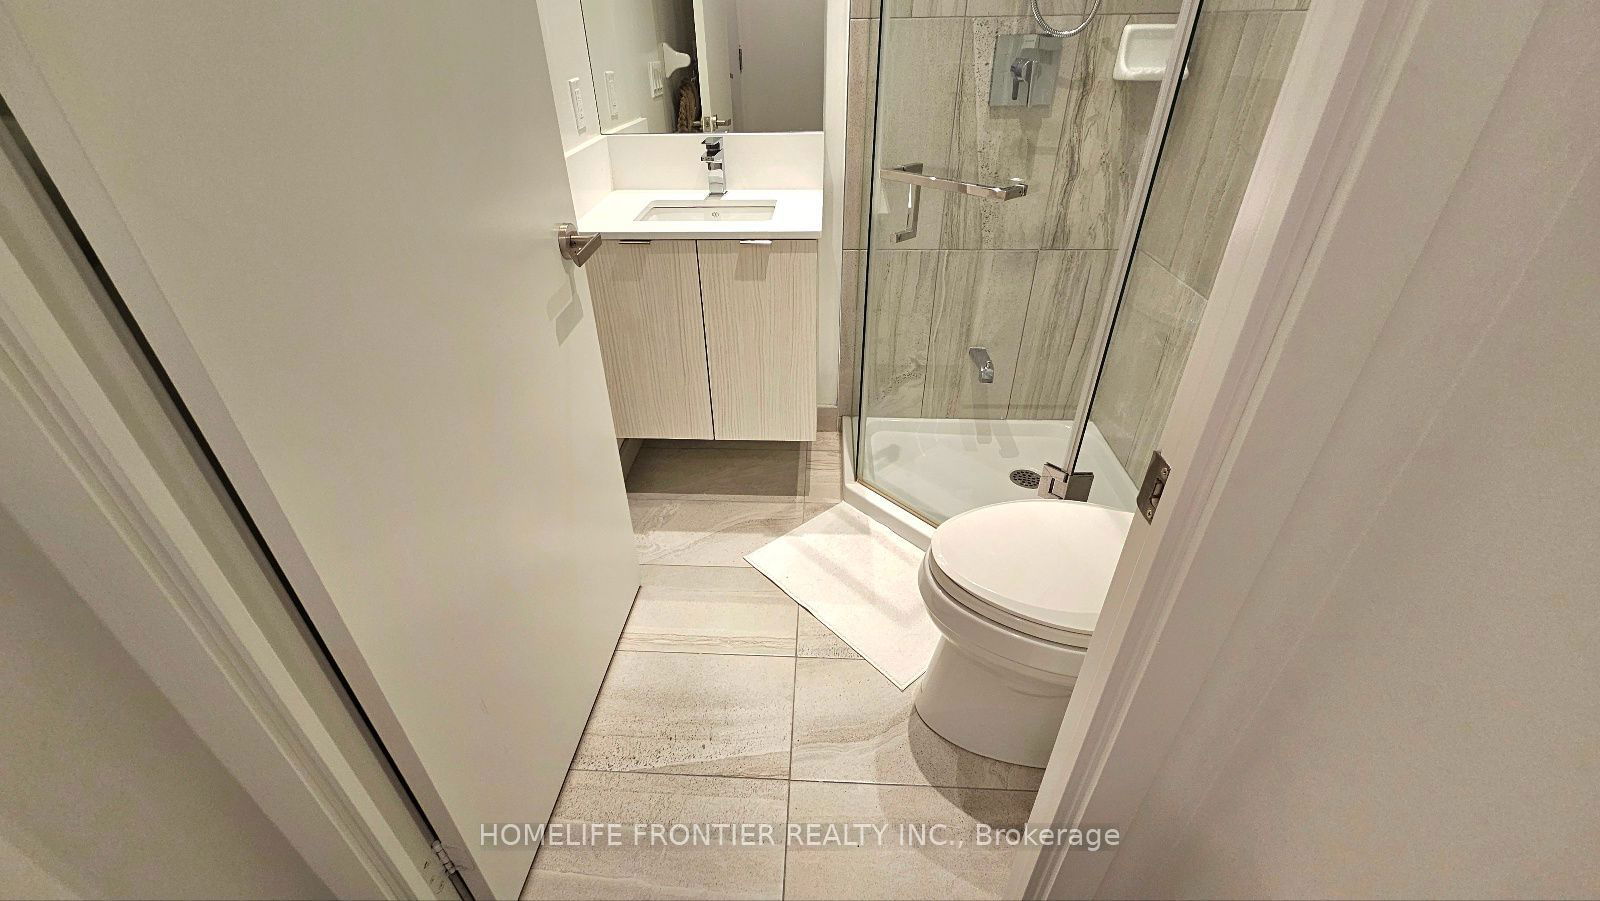
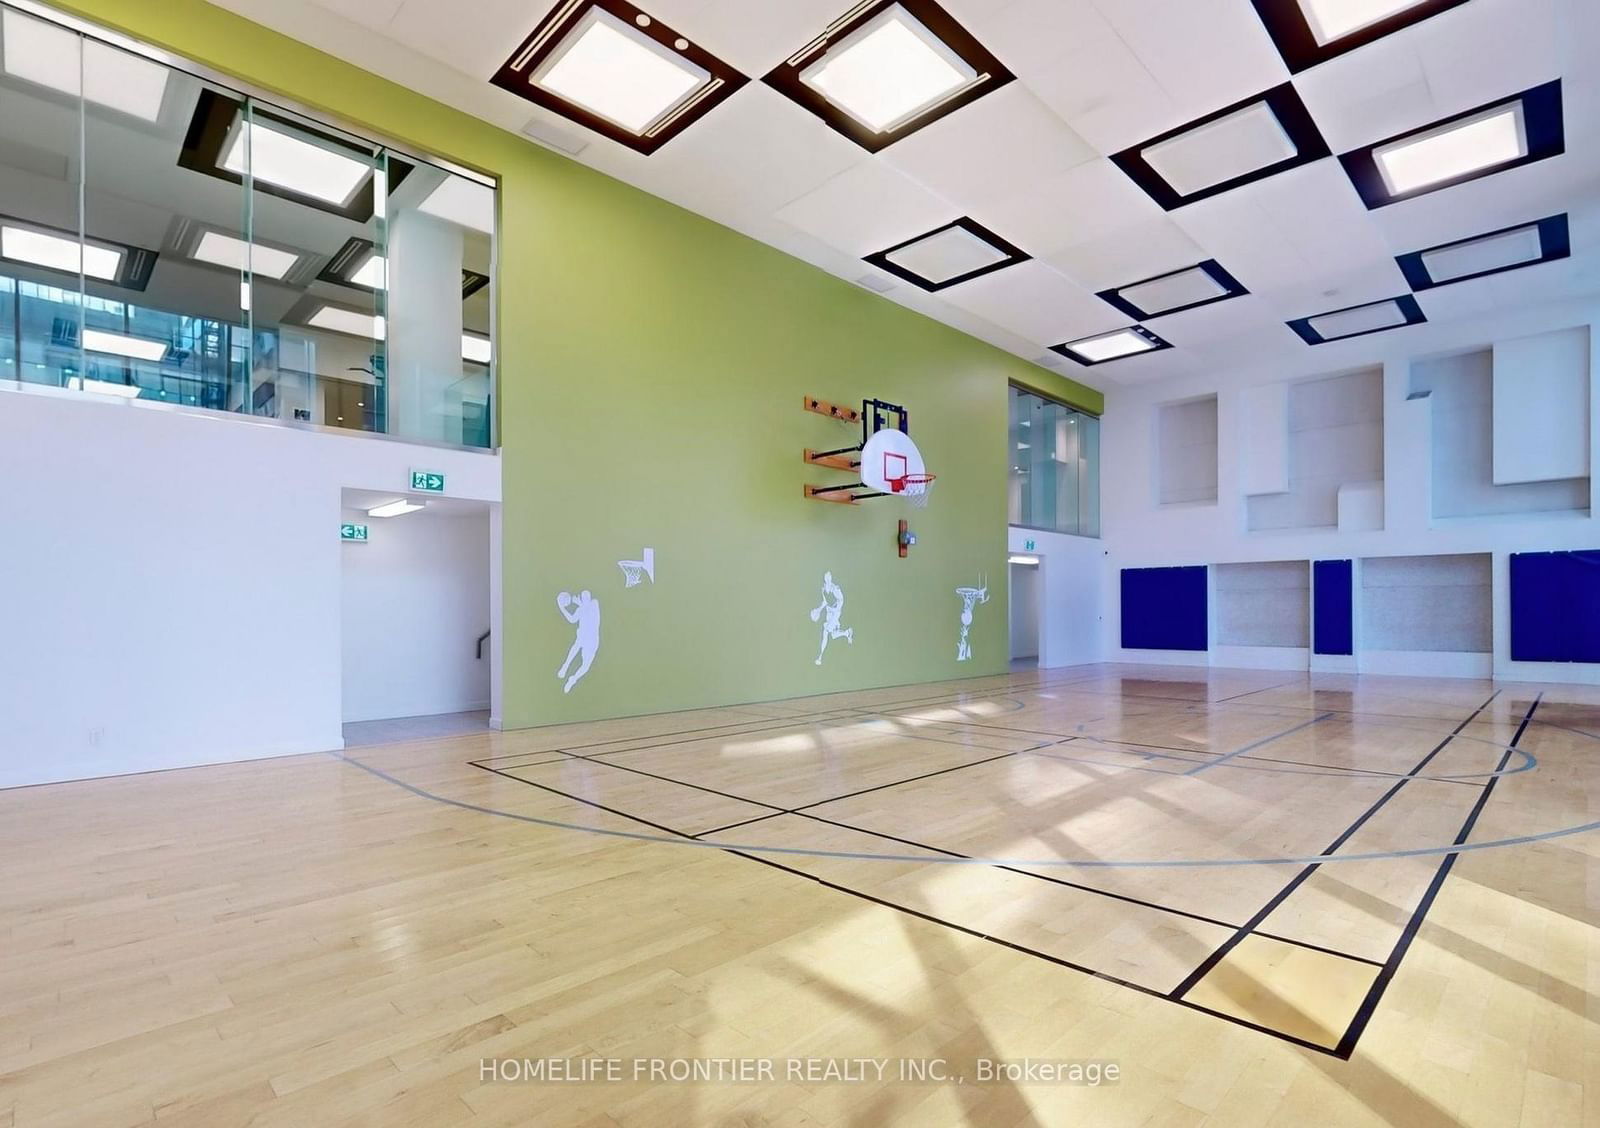
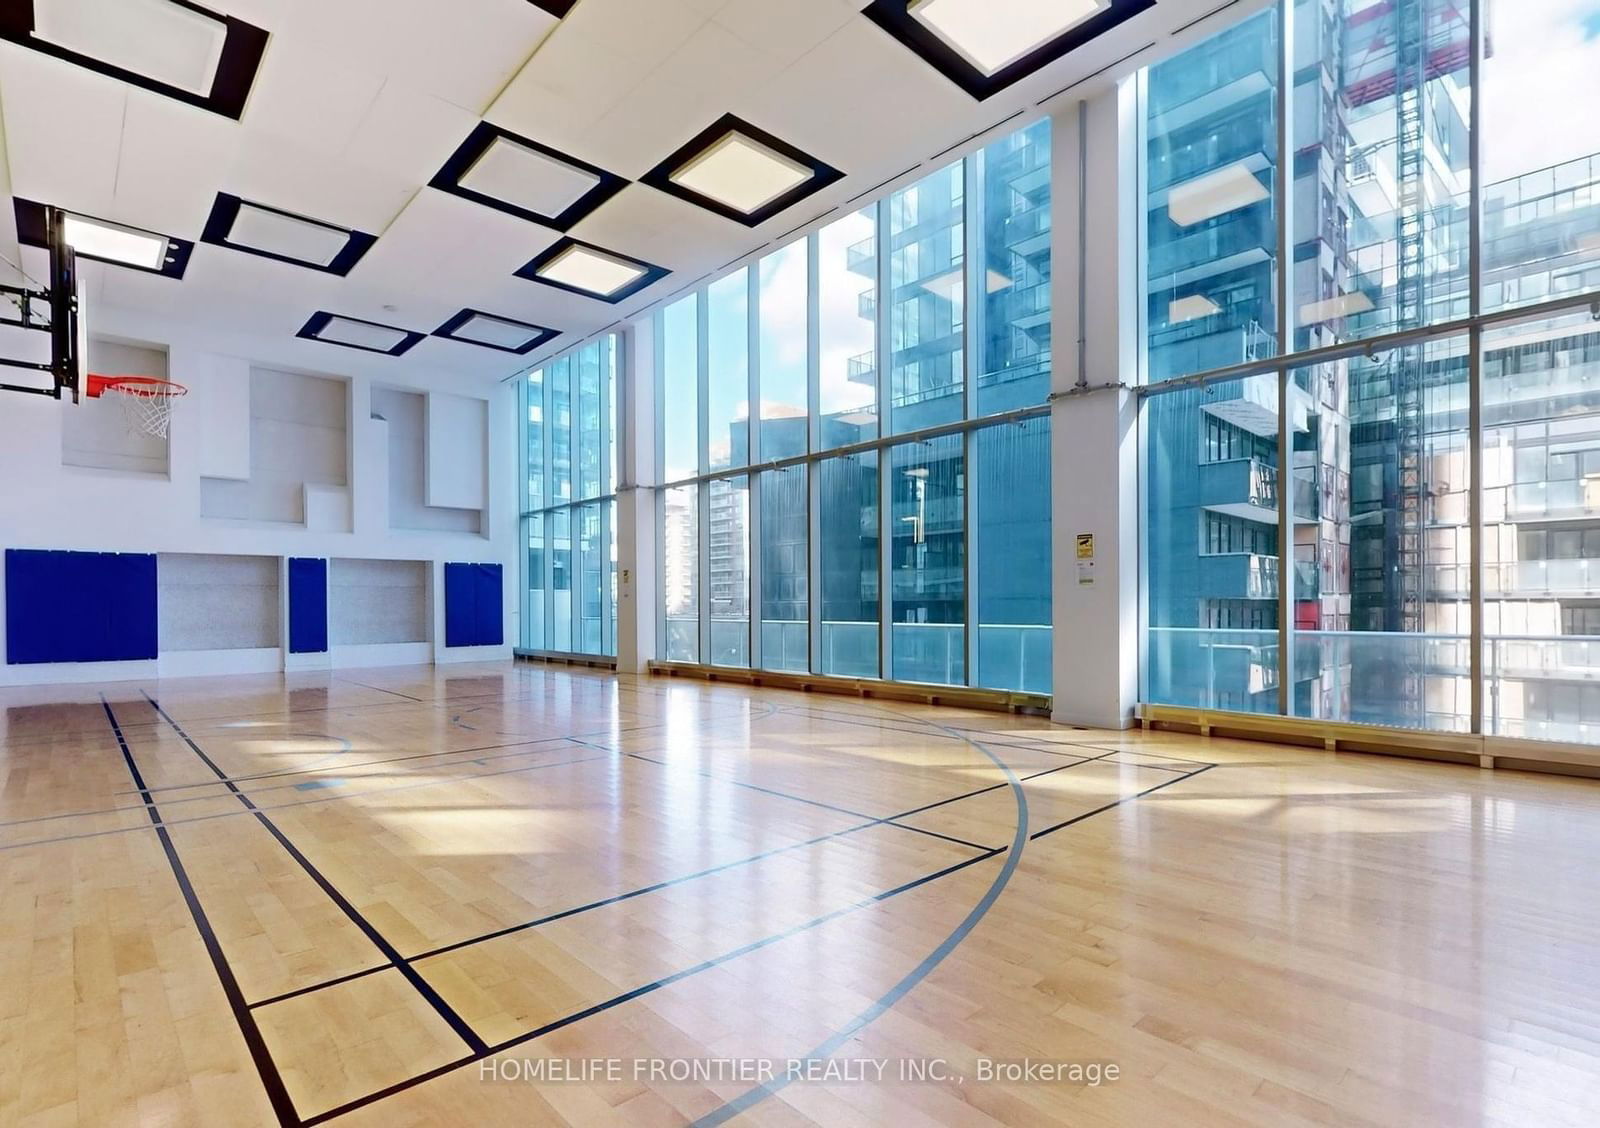
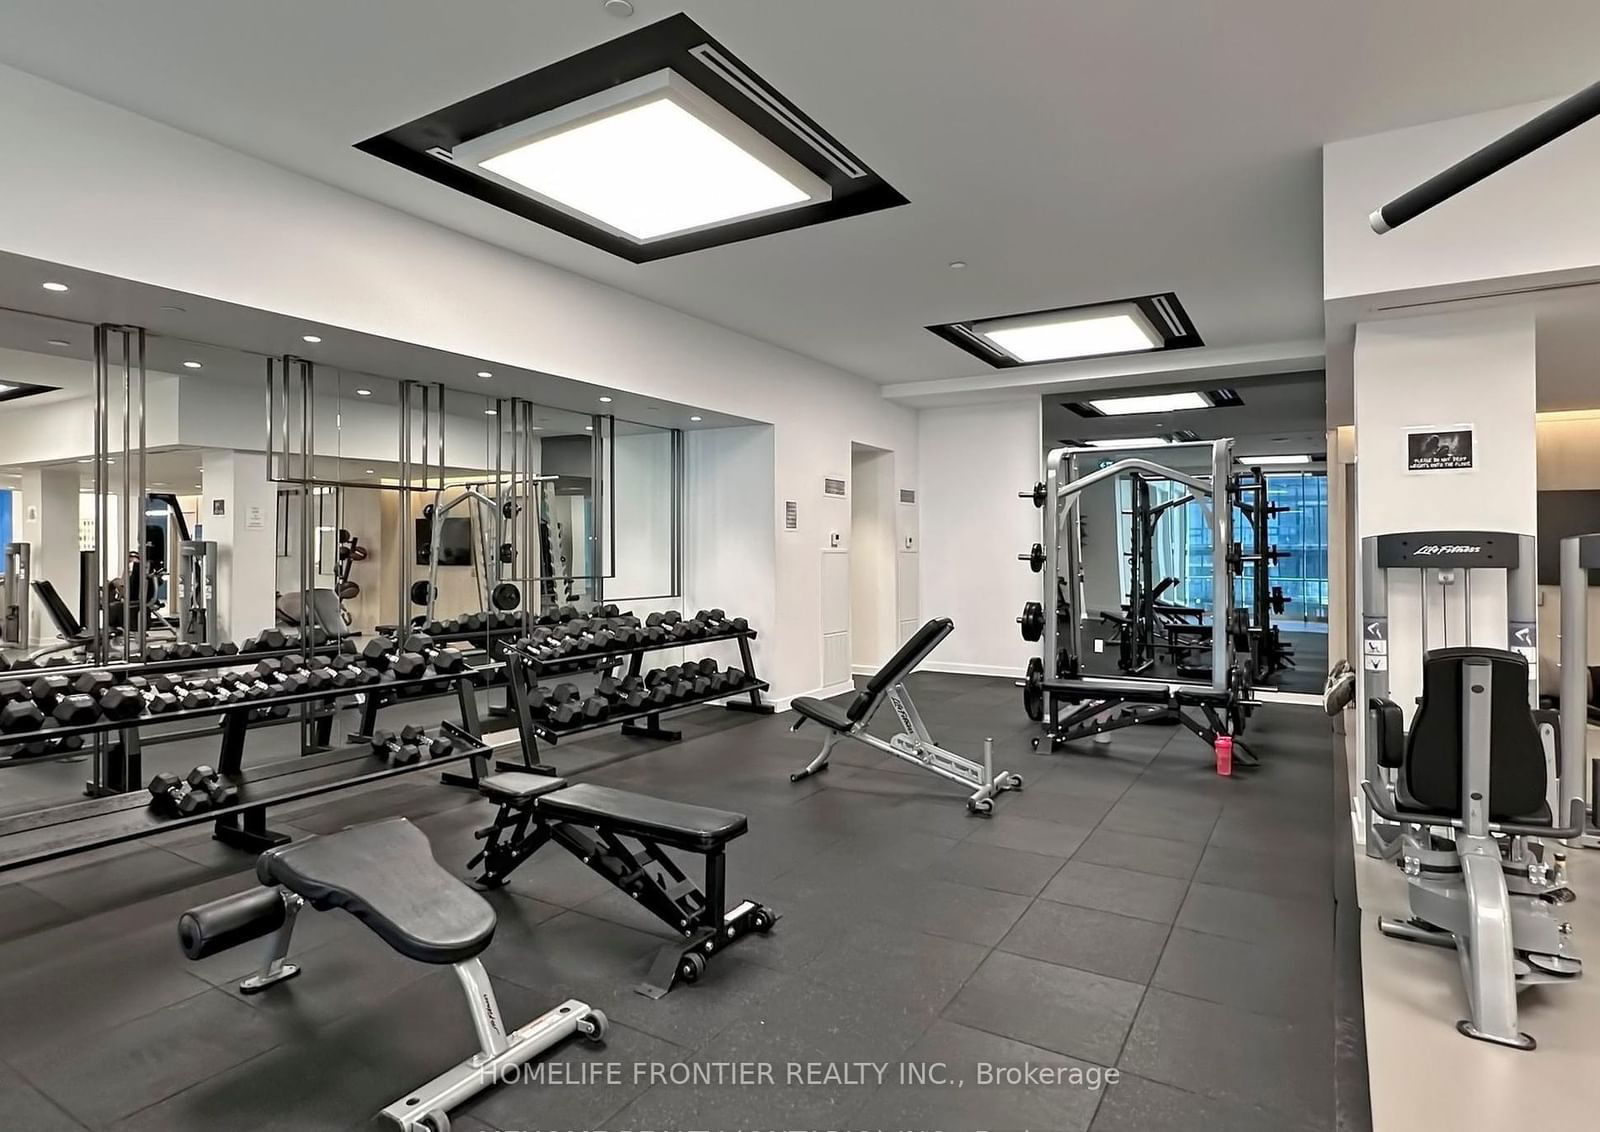
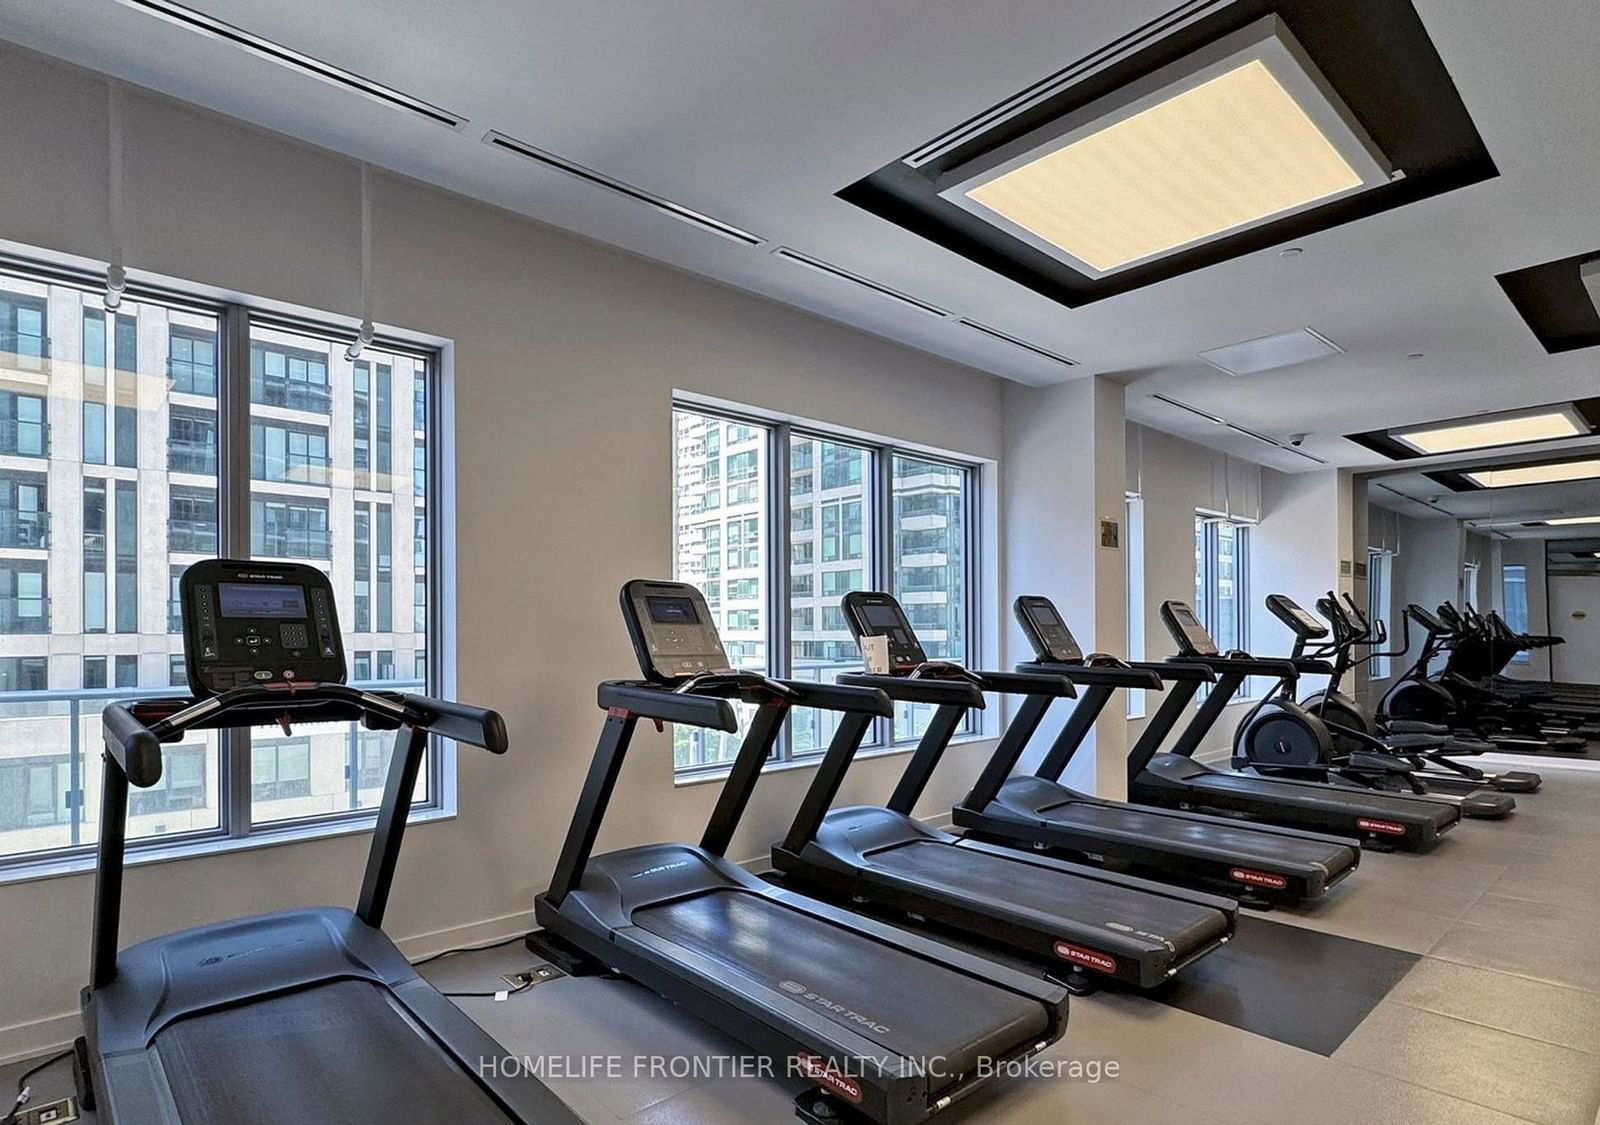
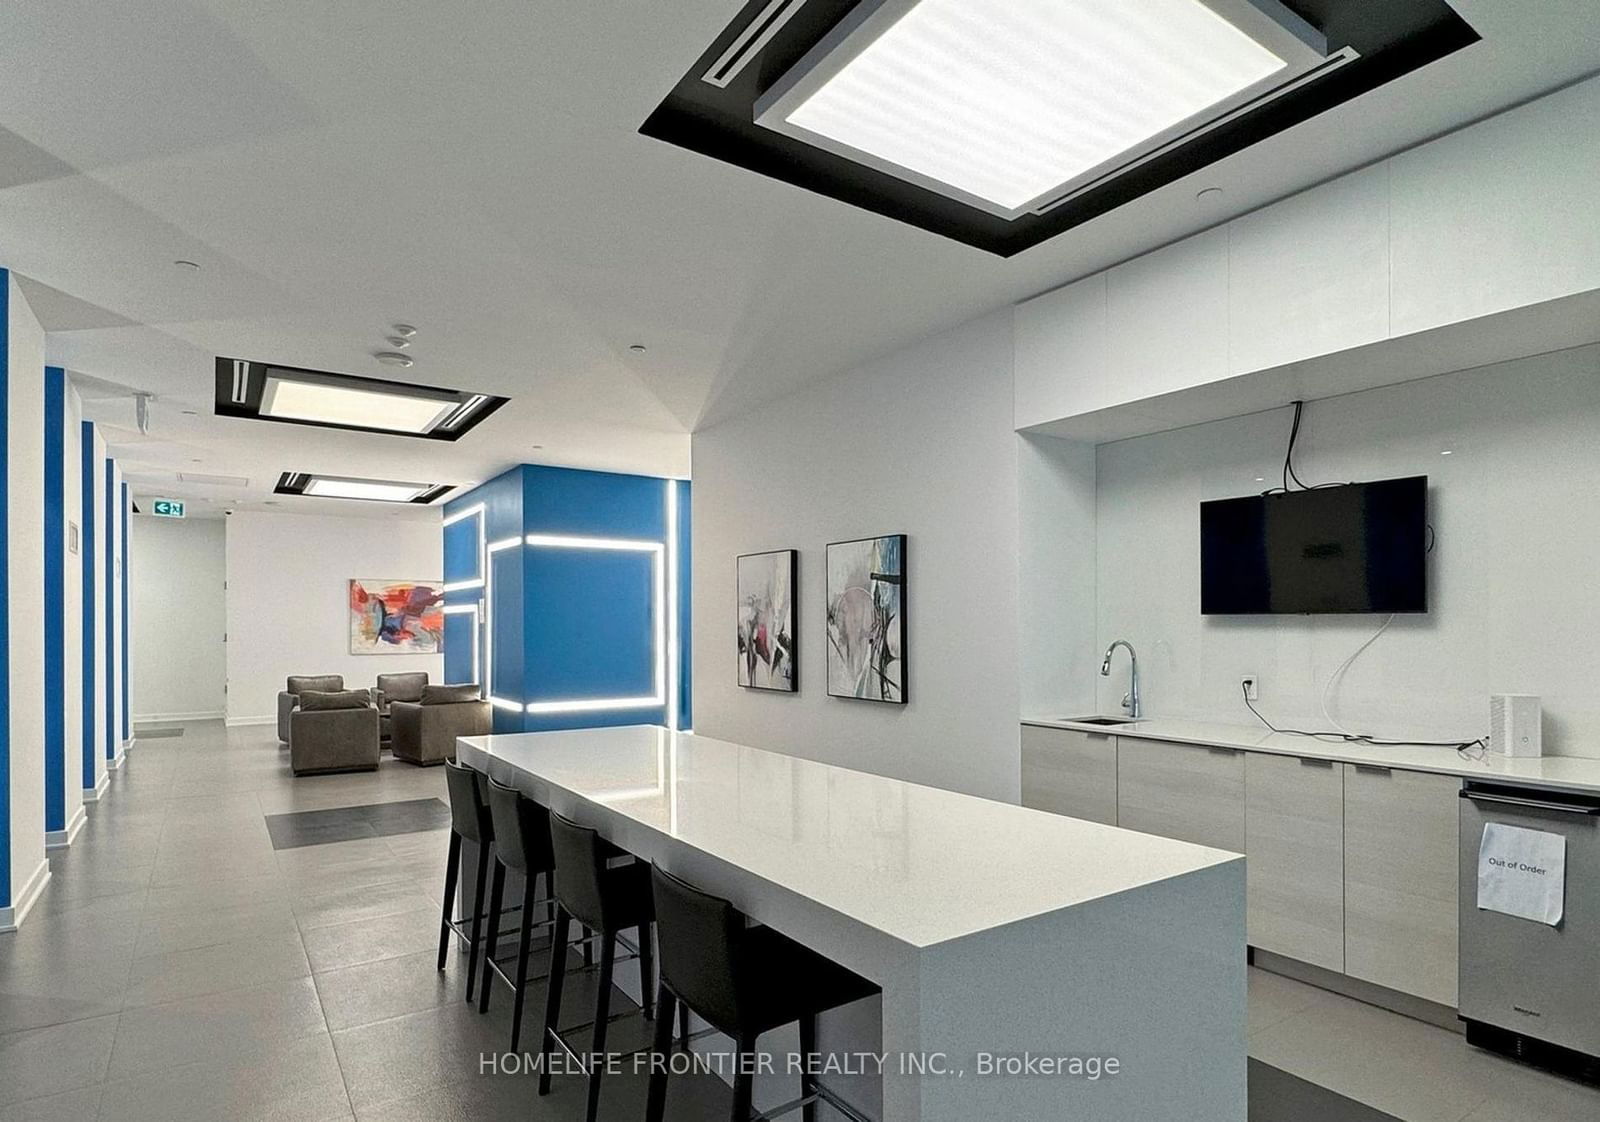
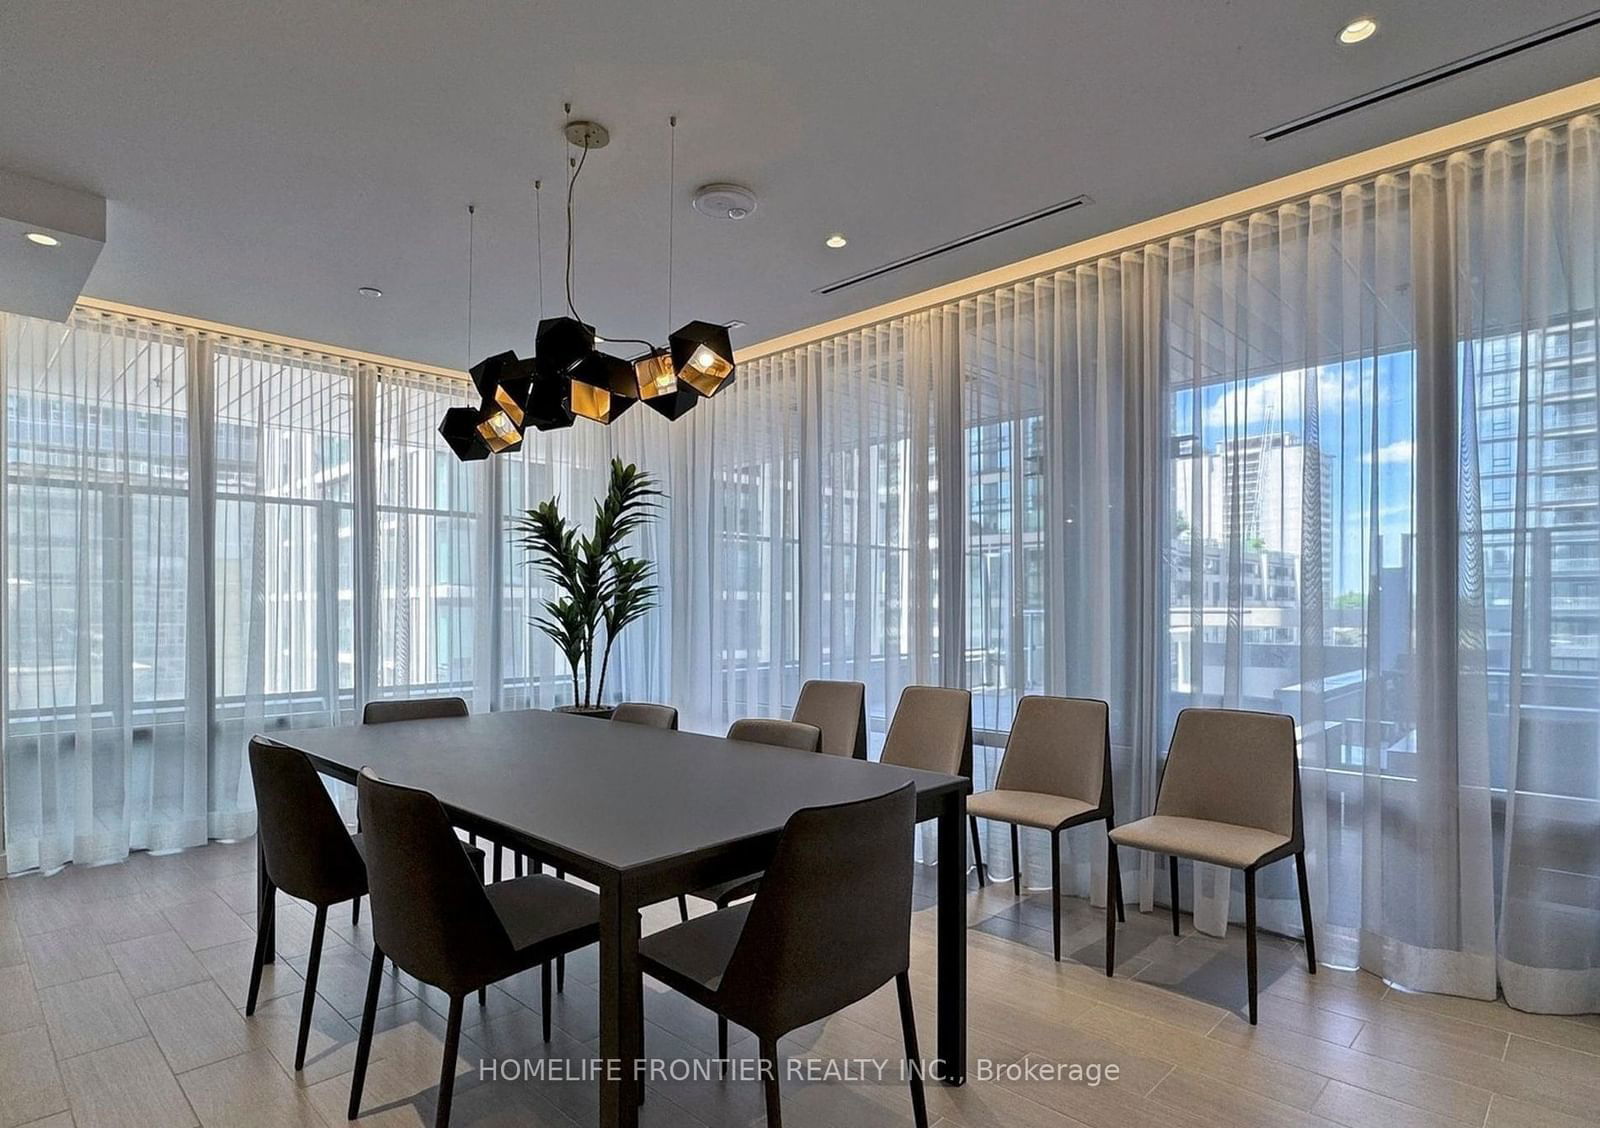
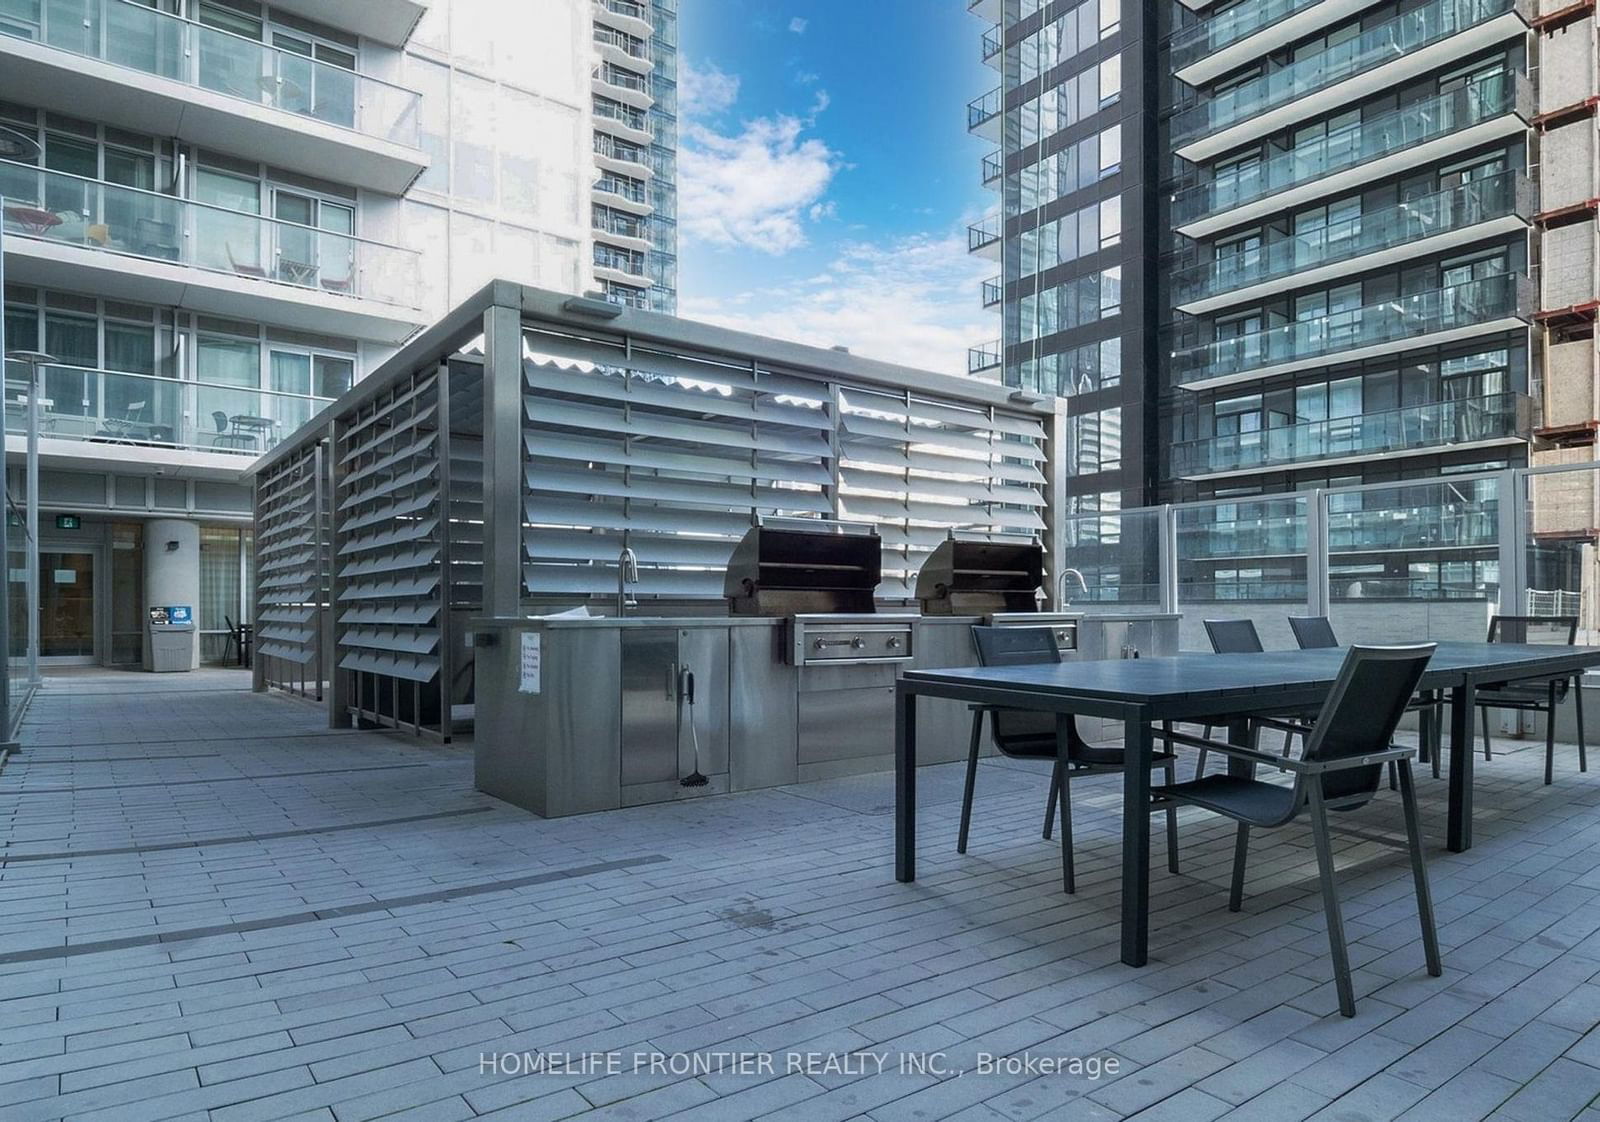
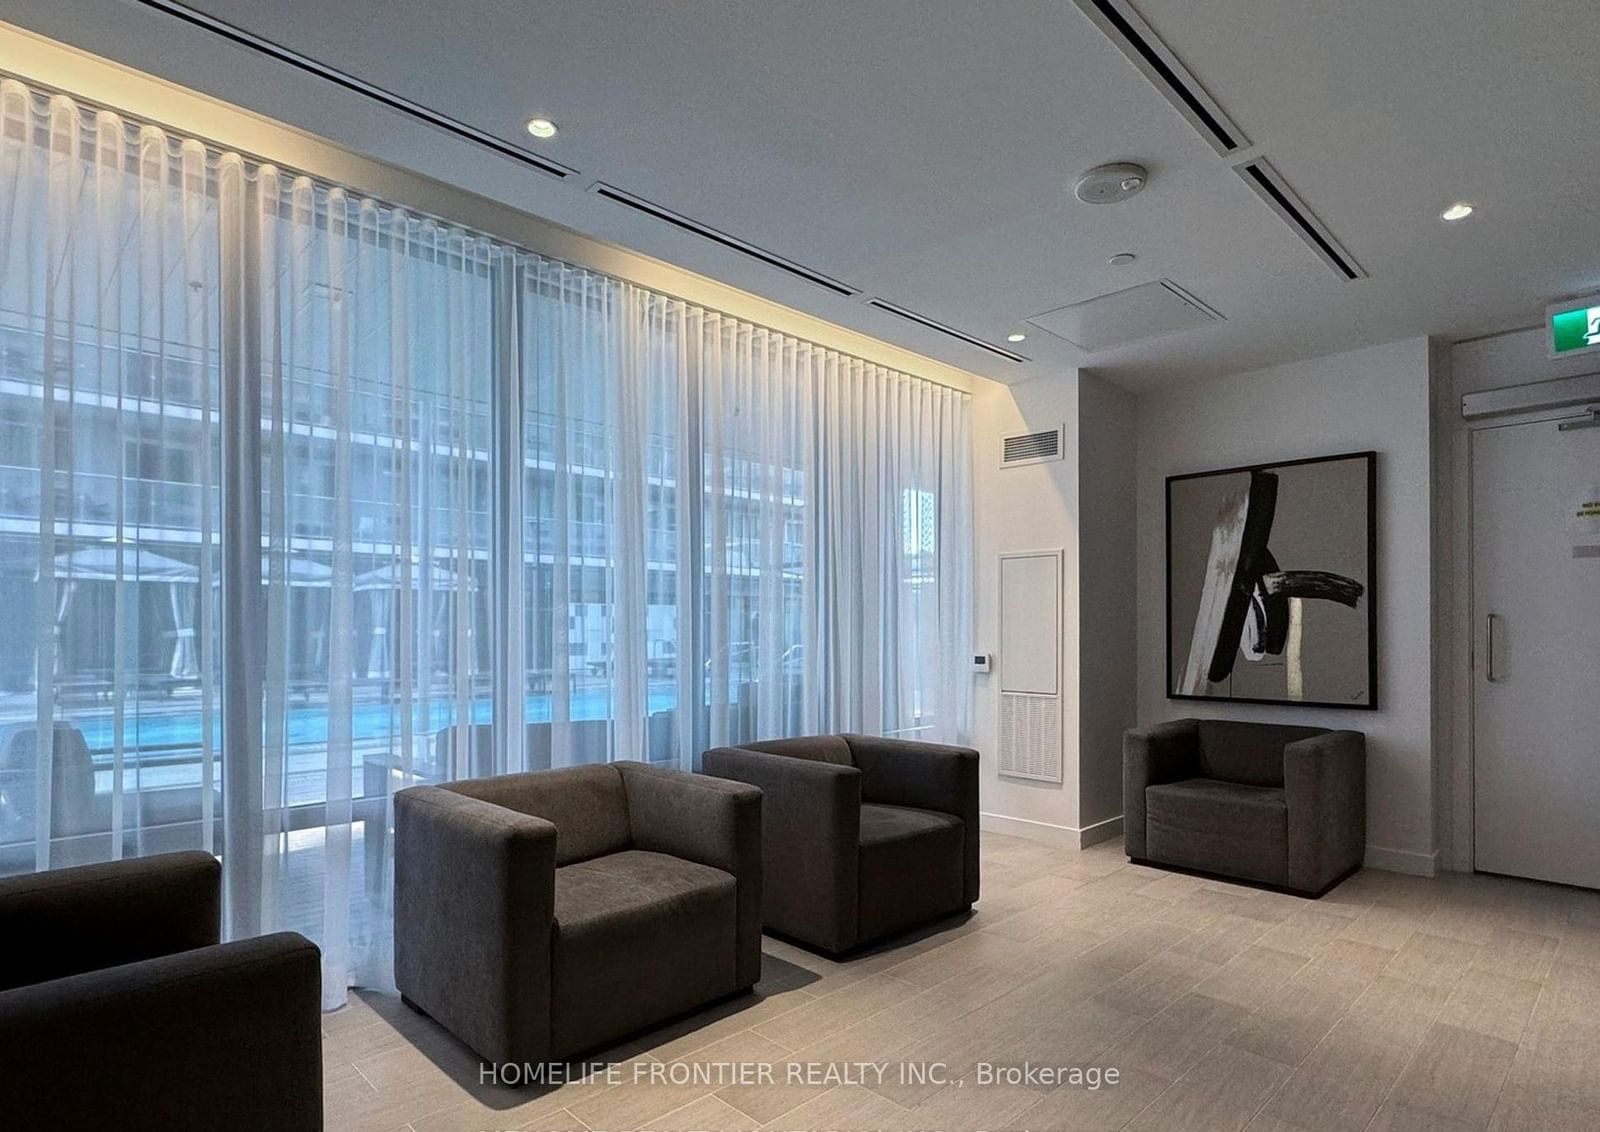
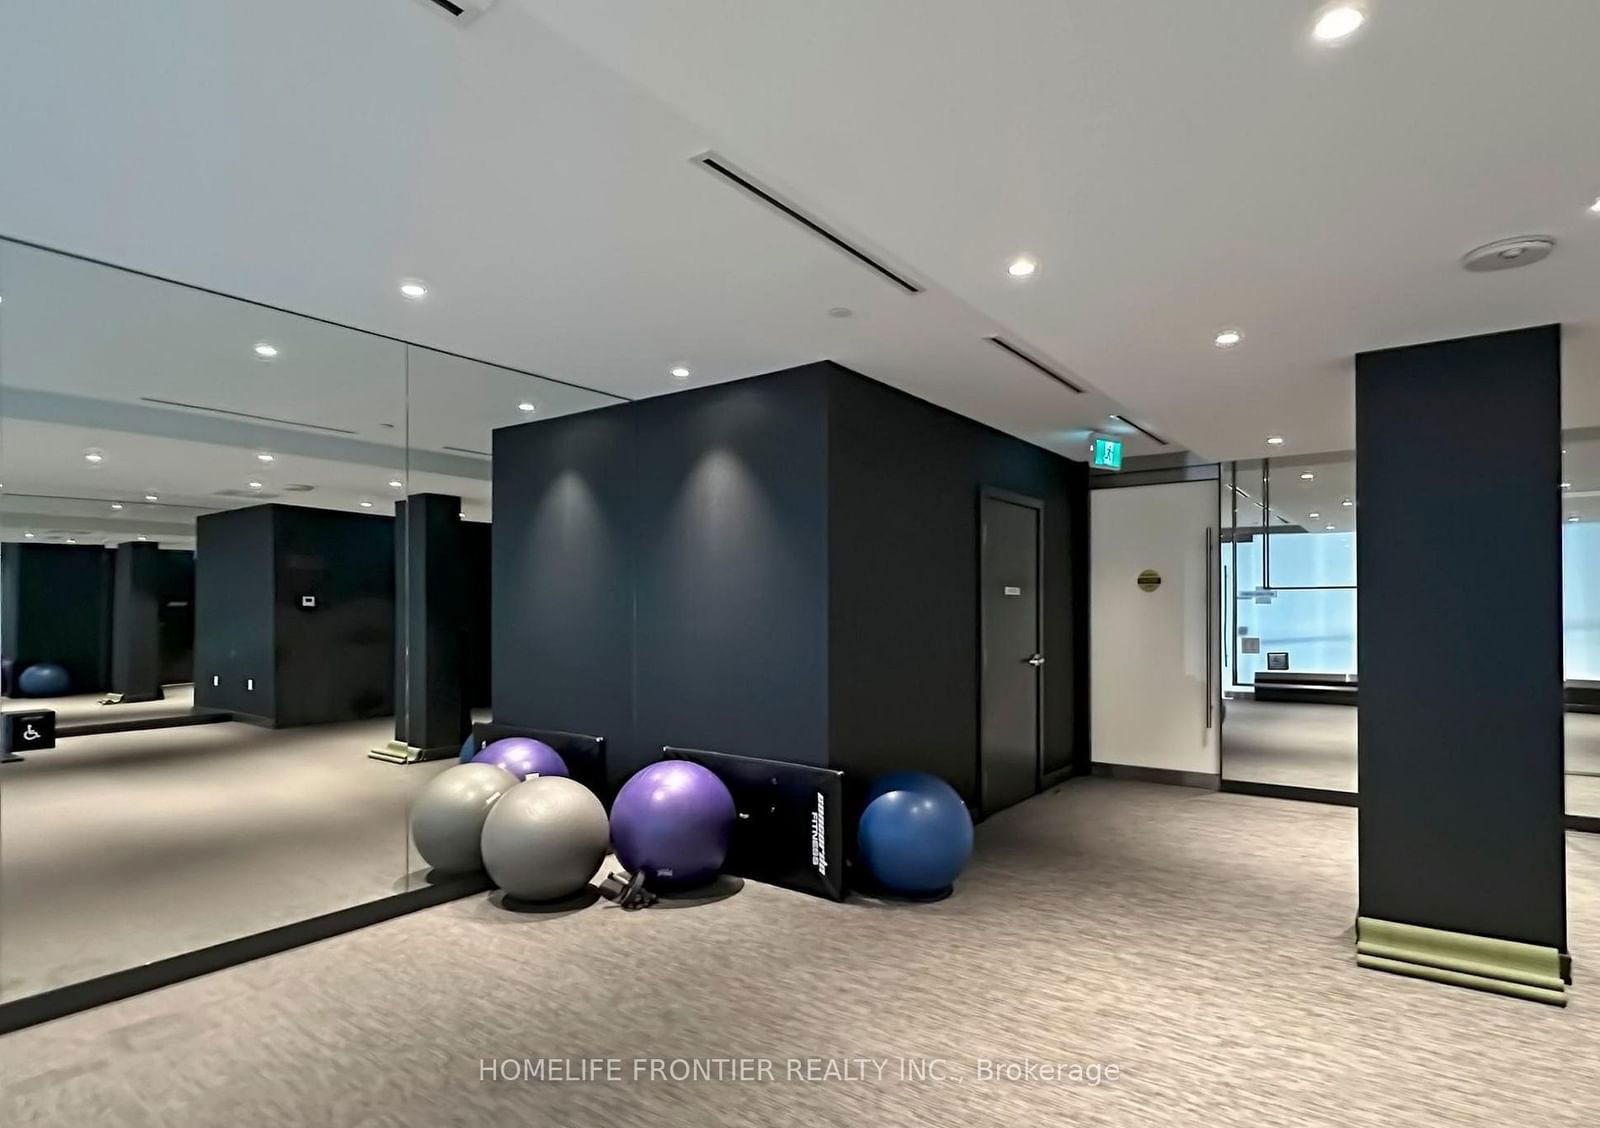
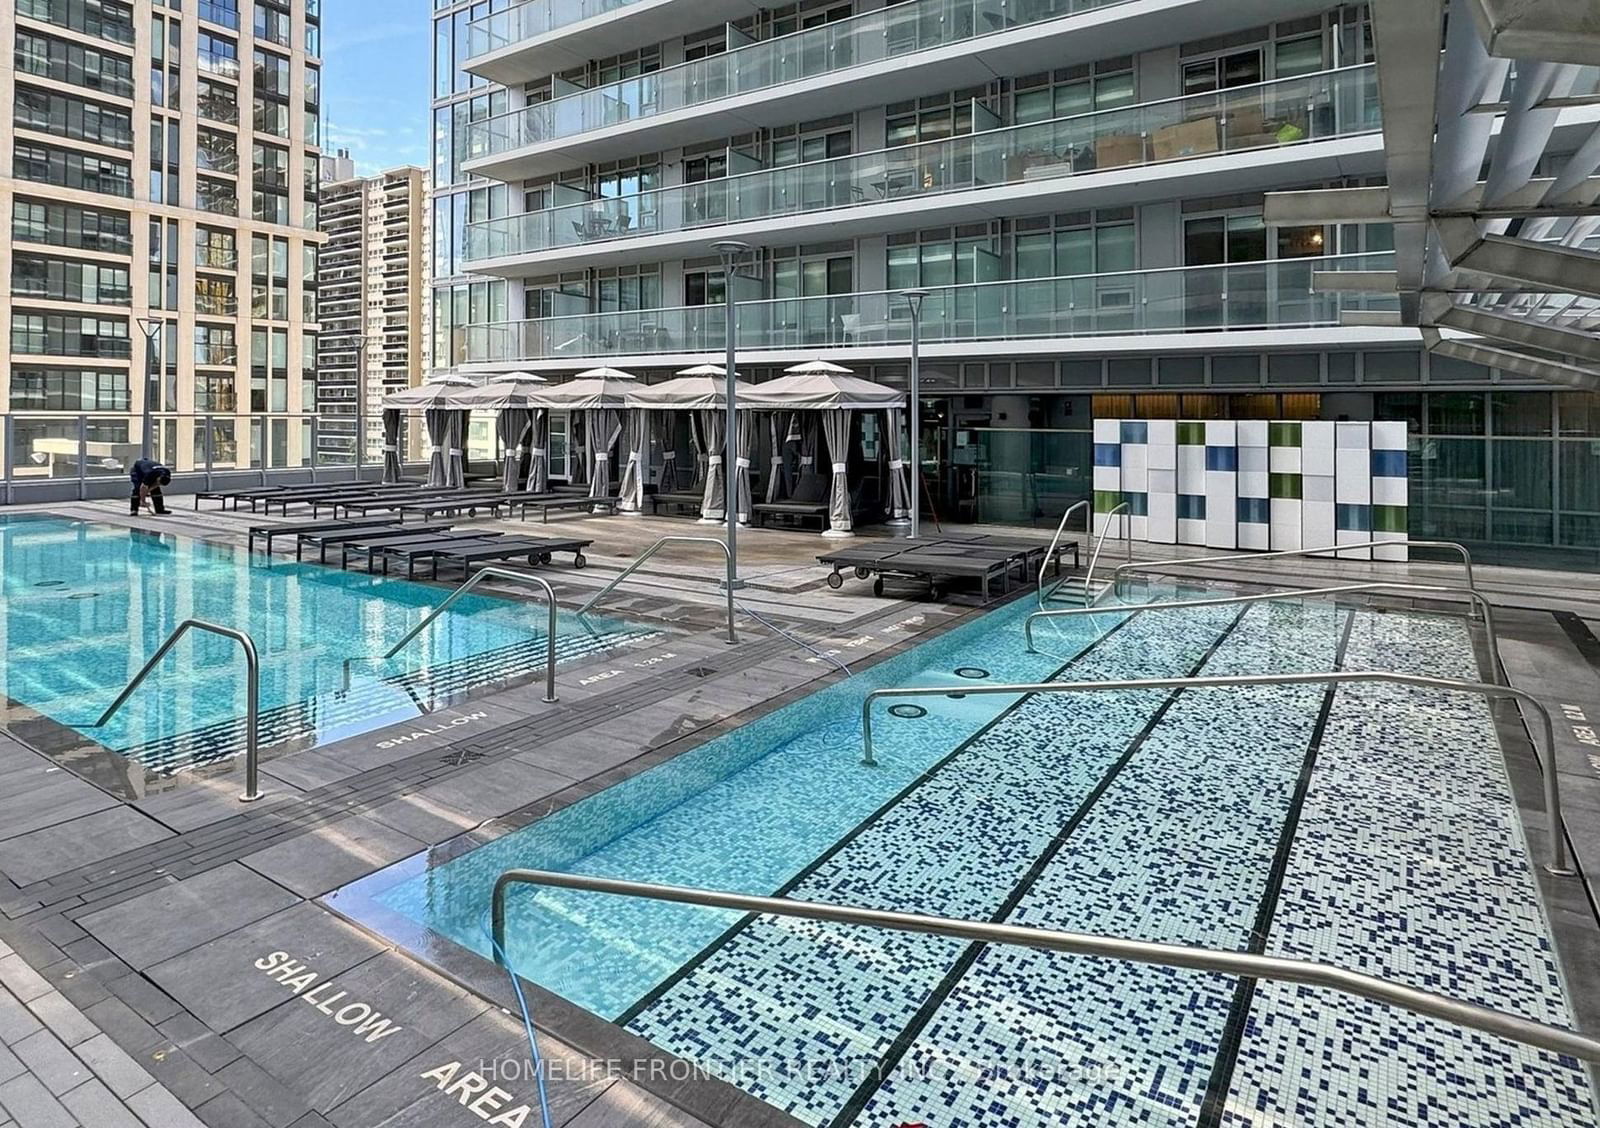
Introducing a fantastic new condo filled with good fortune!! Perfect Layout for newlyweds or young professionals! Located in the most expensive and desirable area of Eglinton, surrounded by pretty restaurants and a lot of entertainment! Don't miss this once-in-a-lifetime opportunity! A chance to own such a great condo at an affordable price wont come around again!! **** EXTRAS **** Amazing Amenities Included 24Hr Concierge, Almost Full Equipped Gym, Indoor Basketball Court, Outdoor Pool, Party Room, Meeting Room, Yoga Room And Outdoor Terrace Close To Subway, Major Banks, Library, Schools, Shopping, Restaurants And Much Much More. Why hesitate? Must See and go for it today!! :)
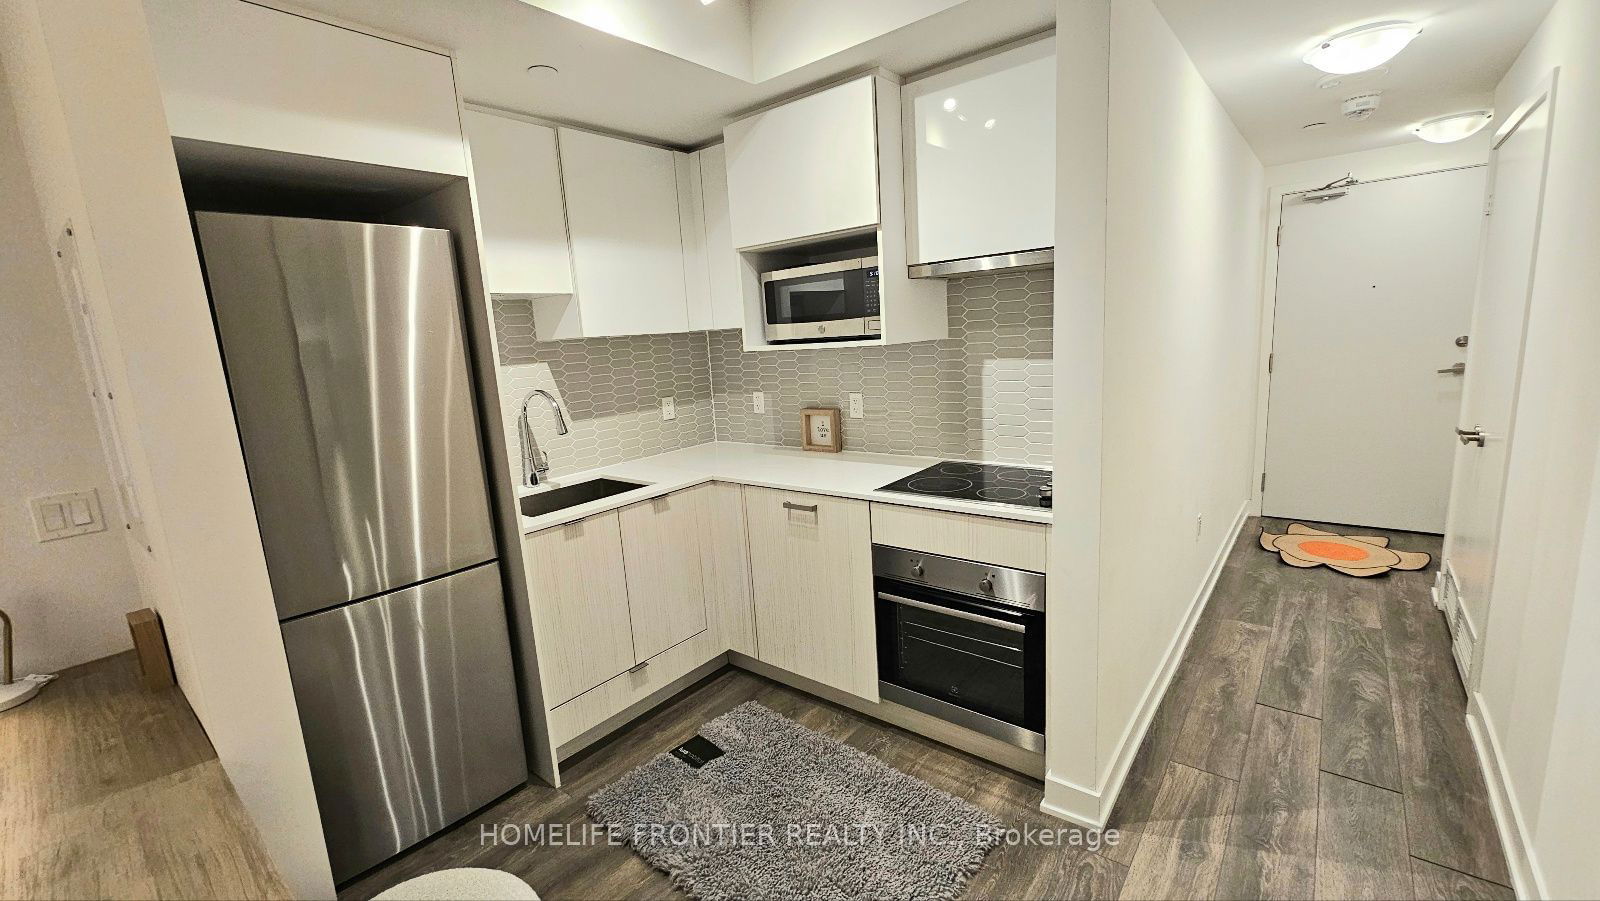
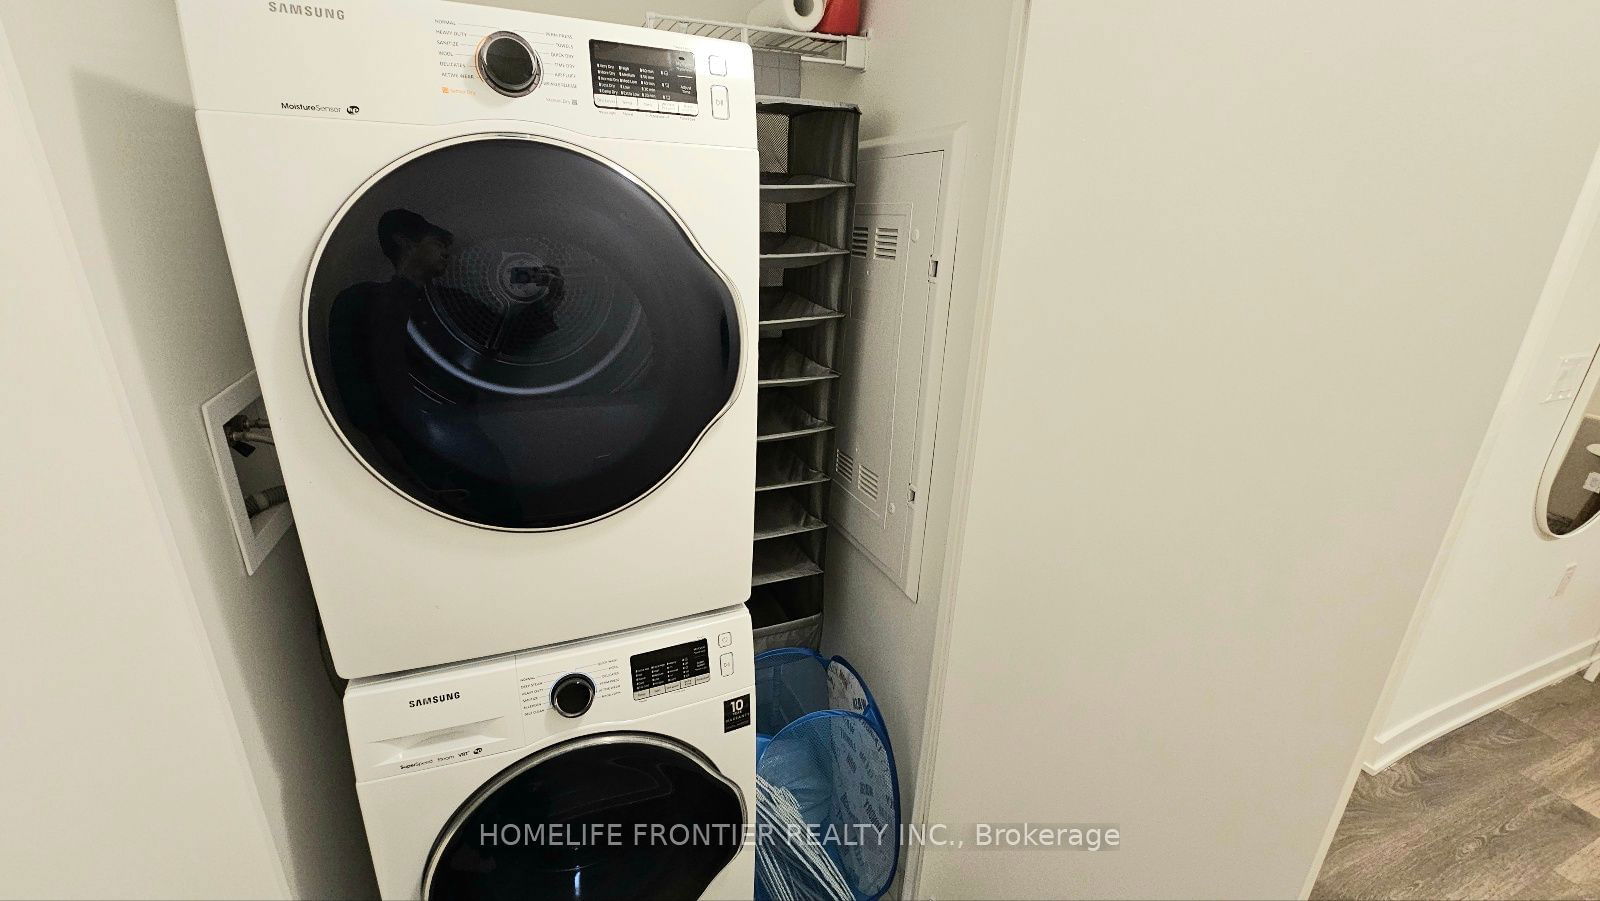
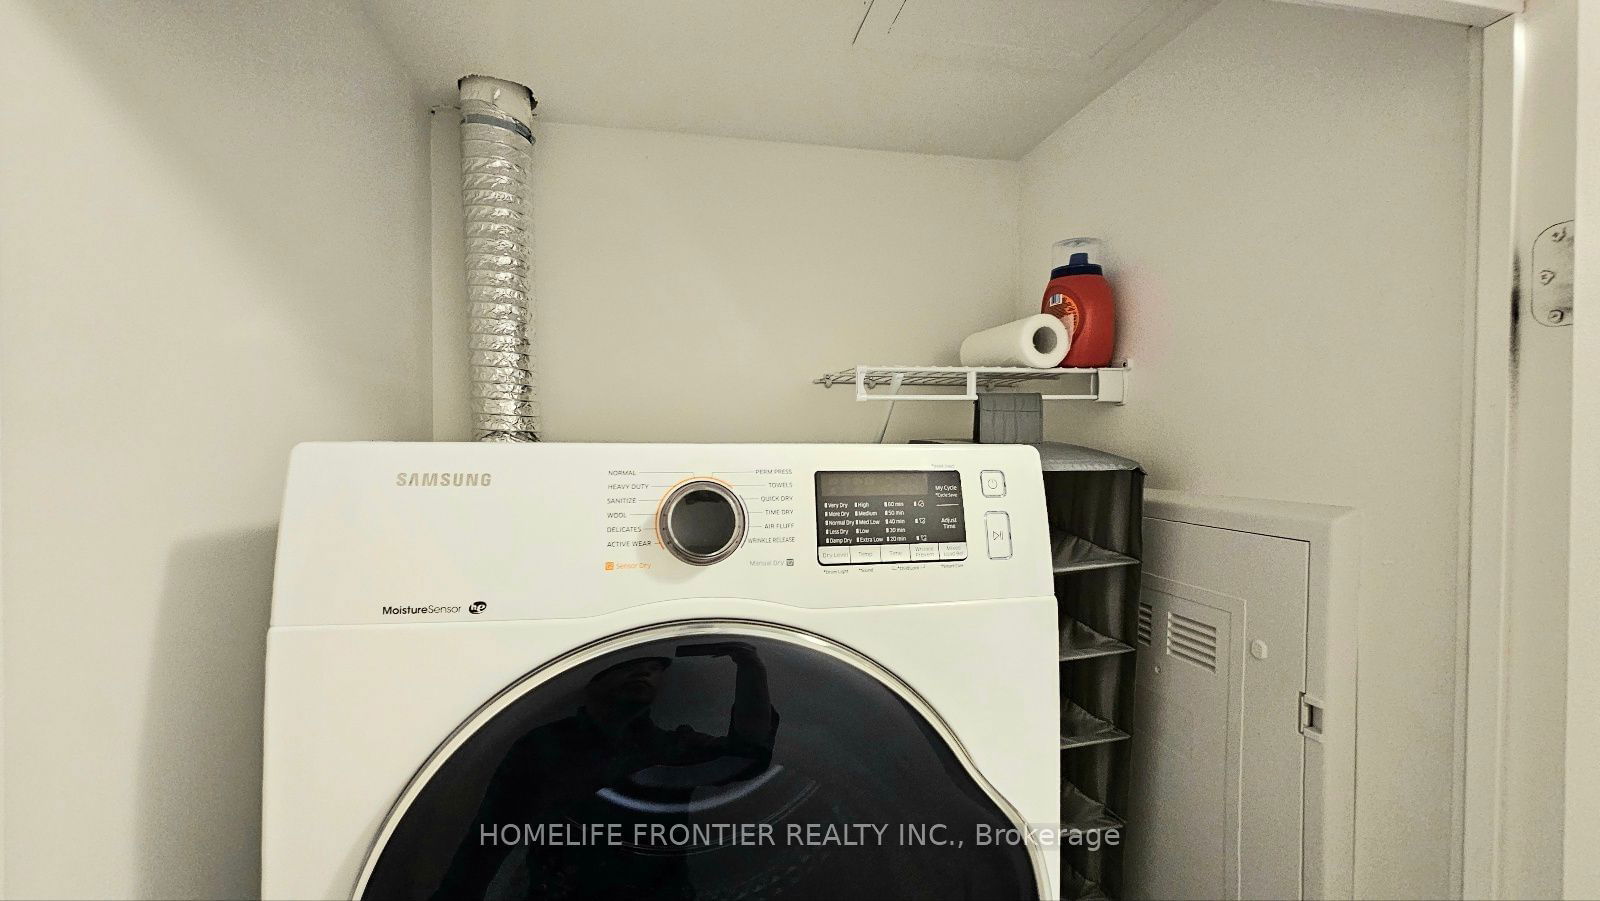
ExtrasWide Plank Laminate Floors, B/I S/S Kitchen Appliances Inc Fridge, Wall Oven, Microwave, Range Hood, Cooktop, Stone Counter-Top, Wash/Dryer, Quartz Window Sills. Internet Included`
homelife frontier realty inc.MLS® #C11932600
Amenities
Explore Neighbourhood
Similar Listings
Demographics
Based on the dissemination area as defined by Statistics Canada. A dissemination area contains, on average, approximately 200 – 400 households.
Price Trends
Maintenance Fees
Building Trends At CityLights on Broadway
Days on Strata
List vs Selling Price
Offer Competition
Turnover of Units
Property Value
Price Ranking
Sold Units
Rented Units
Best Value Rank
Appreciation Rank
Rental Yield
High Demand
Transaction Insights at 99 Broadway Avenue
| Studio | 1 Bed | 1 Bed + Den | 2 Bed | 2 Bed + Den | 3 Bed | 3 Bed + Den | |
|---|---|---|---|---|---|---|---|
| Price Range | $397,000 - $430,000 | $448,000 - $507,500 | $485,000 - $690,000 | $626,800 - $790,000 | $925,000 | No Data | No Data |
| Avg. Cost Per Sqft | $1,138 | $1,062 | $1,047 | $1,059 | $691 | No Data | No Data |
| Price Range | $1,650 - $2,050 | $1,975 - $2,500 | $2,100 - $2,700 | $1,500 - $3,500 | $3,250 - $4,000 | No Data | No Data |
| Avg. Wait for Unit Availability | 131 Days | 40 Days | 38 Days | 53 Days | 518 Days | No Data | No Data |
| Avg. Wait for Unit Availability | 15 Days | 4 Days | 5 Days | 5 Days | 120 Days | No Data | No Data |
| Ratio of Units in Building | 10% | 31% | 30% | 28% | 2% | 1% | 1% |
Transactions vs Inventory
Total number of units listed and sold in Mount Pleasant West
