337 - 50 Power St
Listing History
Unit Highlights
Property Type:
Condo
Maintenance Fees:
$550/mth
Taxes:
$2,700 (2024)
Cost Per Sqft:
$956/sqft
Locker:
None
Outdoor Space:
Balcony
Exposure:
South West
Possession Date:
To Be Arranged
Laundry:
Ensuite
Buyer's Market
Balanced
Seller's Market
Maintenance Fees
Included
Heat
Air Conditioning
Parking
Building Maintenance
Building Insurance
Excluded
Hydro
Water
Utility Type
- Air Conditioning
- Central Air
- Heat Source
- Gas
- Heating
- Forced Air
Room Dimensions
Living
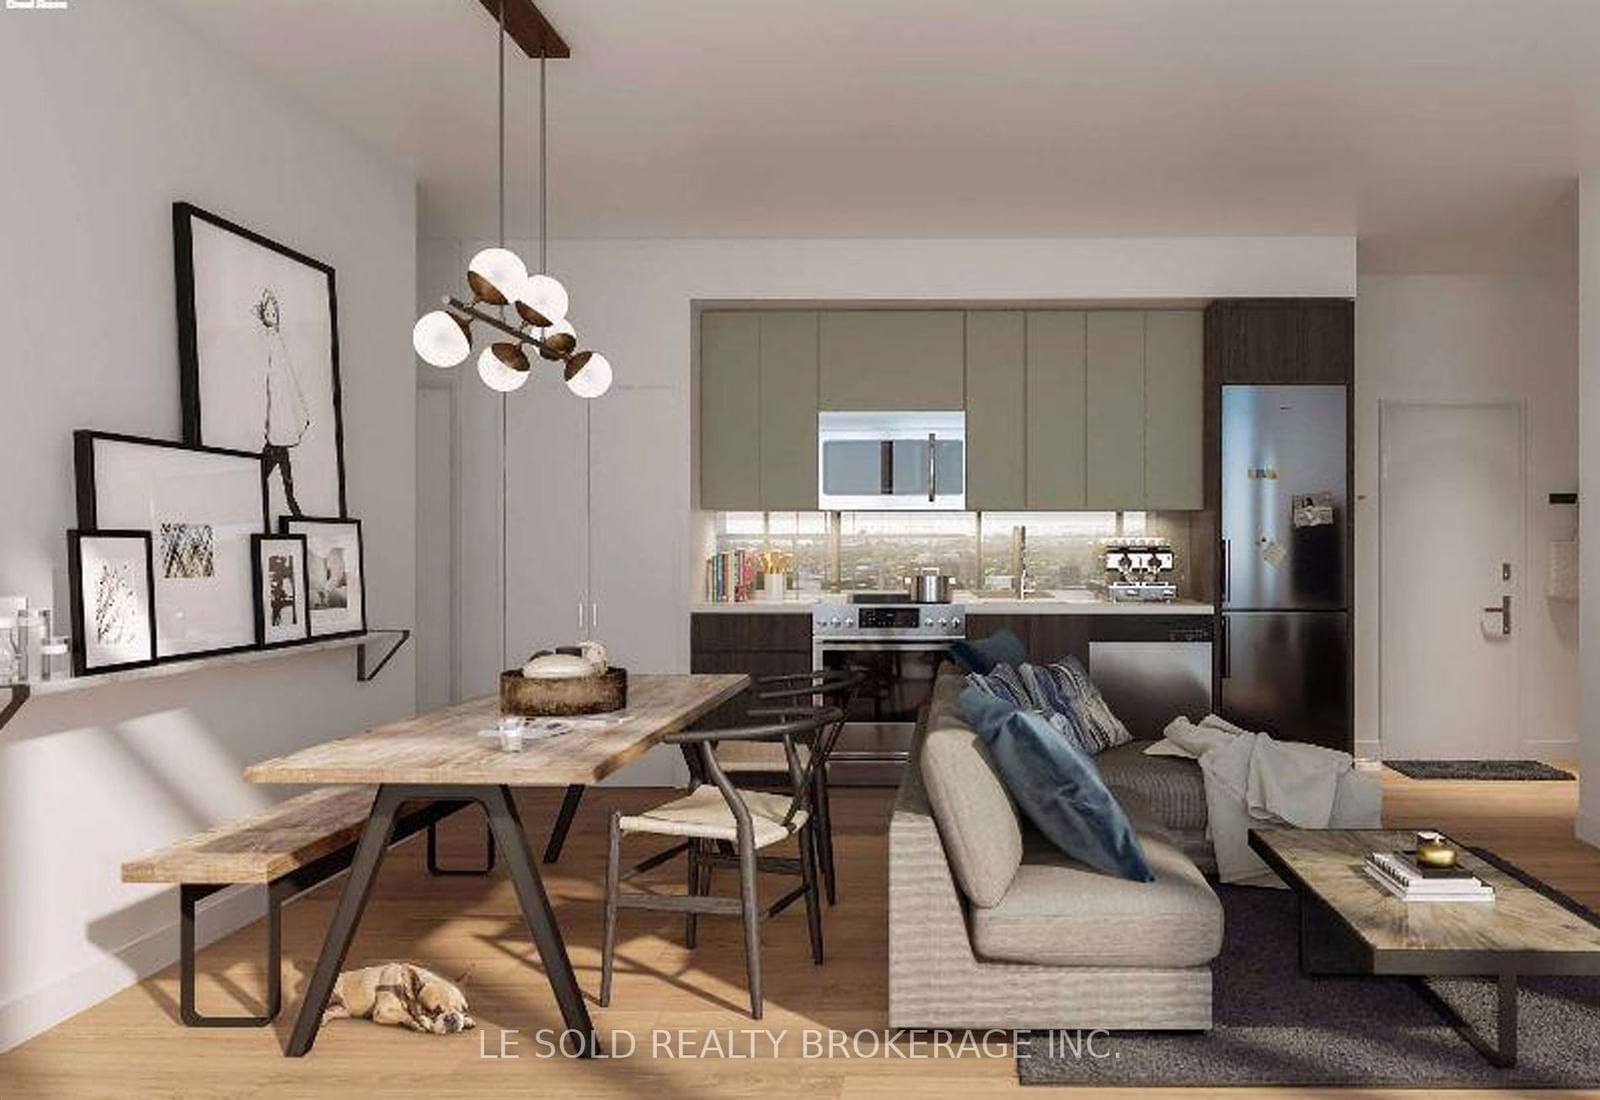
Combined with Dining, Large Window, Walkout To Balcony
0 x 0ft
Kitchen
Open Concept, Built-in Appliances, Combined with Dining
0 x 0ft
Dining
Combined with Kitchen, Open Concept
0 x 0ft
About this Listing
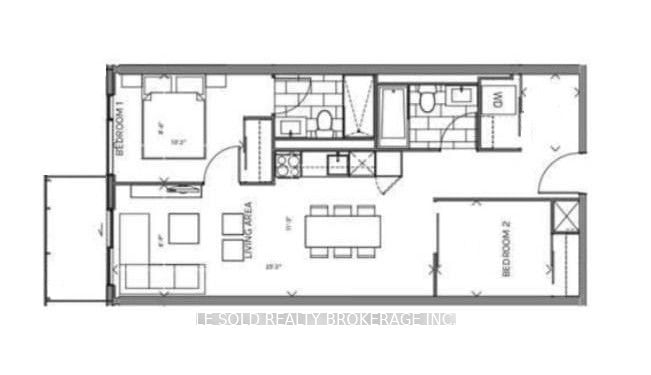
Brand New 2+1 bedroom condo. Over 700 sqft. Located in the heart of Toronto's Dynamic And Vibrant Downtown East. Modern finishes, integrated appliances. Large window with a lot of sunshine, enjoy city view. Easy access to TTC, Gardener Expressway and Hwy DVP. Close to shops, distillery, Cherry Beach, St. Lawrence Market, YMCA & George Brown College. Amenities include: 24hr concierge, gym, party room, and more.
ExtrasFridge, Stove, Dishwasher, Washer & Dryer. One Underground Parking.
le sold realty brokerage inc.MLS® #C11907854
Amenities
Concierge
Media Room
Party Room
Gym Room
Rooftop Deck
Games Room
Explore Neighbourhood
9/10
Walkability
One small step for you. One giant leap towards never needing a gym membership.
10/10
Transit
Meet the heartbeat of the city — transit so smooth, you’ll never miss a beat.
9/10
Bikeability
Pedal paradise! You might as well have wheels for feet.
Similar Listings
Demographics
Based on the dissemination area as defined by Statistics Canada. A dissemination area contains, on average, approximately 200 – 400 households.
Population
11,959
Average Individual Income
$60,766
Average Household Size
3 persons
Average Age
44
Average Household Income
$102,581
Dominant Housing Type
High Rise Apartment
Population By Age
Household Income
Housing Types & Tenancy
High Rise Apartment
47%
Detached
33%
Semi Detached
10%
Duplex
5%
Low Rise Apartment
4%
Marital Status
Commute
Languages (Primary Language)
Other
74%
Mandarin
10%
Cantonese
9%
Arabic
2%
Tagalog
2%
Telugu
1%
Hindi
1%
Spanish
1%
Education
University and Above
40%
High School
23%
College
15%
None
14%
Apprenticeship
3%
University Below Batchelor
3%
Major Field of Study
Business Management
25%
Architecture & Engineering
22%
Health & Related Fields
11%
Math & Computer Sciences
10%
Social Sciences
9%
Physical Sciences
5%
Humanities
4%
Education
3%
Visual & Performing Arts
3%
Personal, Protective & Transportation Services
2%
Agriculture & Natural Resources
1%
Price Trends
Maintenance Fees
Home Power + Adelaide Condos vs The Corktown - Toronto Area
Building Trends At Home Power + Adelaide Condos
Days on Strata
Units at Home Power + Adelaide Condos spend an average of
44
Days on Strata
based on recent sales
List vs Selling Price
On average, these condos sell for
1%
below
the list price.
Offer Competition
Condos in this building have an
AVERAGEchance of receiving
Multiple Offers
compared to other buildings in Corktown - Toronto
Turnover of Units
On average, each unit is owned for
4.7
YEARS before being sold againProperty Value
-7%
Decrease in property value within the past twelve months
Price Ranking
12th
Highest price per SQFT out of 19 condos in the Corktown - Toronto area
Sold Units
24
Units were Sold over the past twelve months
Rented Units
109
Units were Rented over the past twelve months
Best Value Rank
Home Power + Adelaide Condos offers the best value out of 19 condos in the Corktown - Toronto neighbourhood
?
Appreciation Rank
Home Power + Adelaide Condos has the highest ROI out of 19 condos in the Corktown - Toronto neighbourhood
?
Rental Yield
Home Power + Adelaide Condos yields the highest rent prices out of 19 condos in the Corktown - Toronto neighbourhood
?
High Demand
Home Power + Adelaide Condos is the most popular building out of 19 condos in the Corktown - Toronto neighbourhood
?
Transaction Insights at 48 Power Street
| Studio | 1 Bed | 1 Bed + Den | 2 Bed | 2 Bed + Den | 3 Bed | 3 Bed + Den | |
|---|---|---|---|---|---|---|---|
| Price Range | No Data | $455,000 - $510,000 | $540,000 - $558,000 | $590,000 - $860,000 | $830,000 | $878,000 - $1,100,000 | No Data |
| Avg. Cost Per Sqft | No Data | $962 | $881 | $1,011 | $1,010 | $907 | No Data |
| Price Range | No Data | $2,000 - $2,300 | $2,150 - $2,500 | $2,450 - $3,500 | $2,900 - $4,200 | $3,700 - $4,500 | $3,050 - $3,800 |
| Avg. Wait for Unit Availability | No Data | 61 Days | 92 Days | 42 Days | 108 Days | 105 Days | No Data |
| Avg. Wait for Unit Availability | No Data | 14 Days | 9 Days | 6 Days | 19 Days | 41 Days | 70 Days |
| Ratio of Units in Building | 1% | 16% | 23% | 39% | 14% | 8% | 3% |
Transactions vs Inventory
Total number of units listed and sold in Corktown - Toronto


