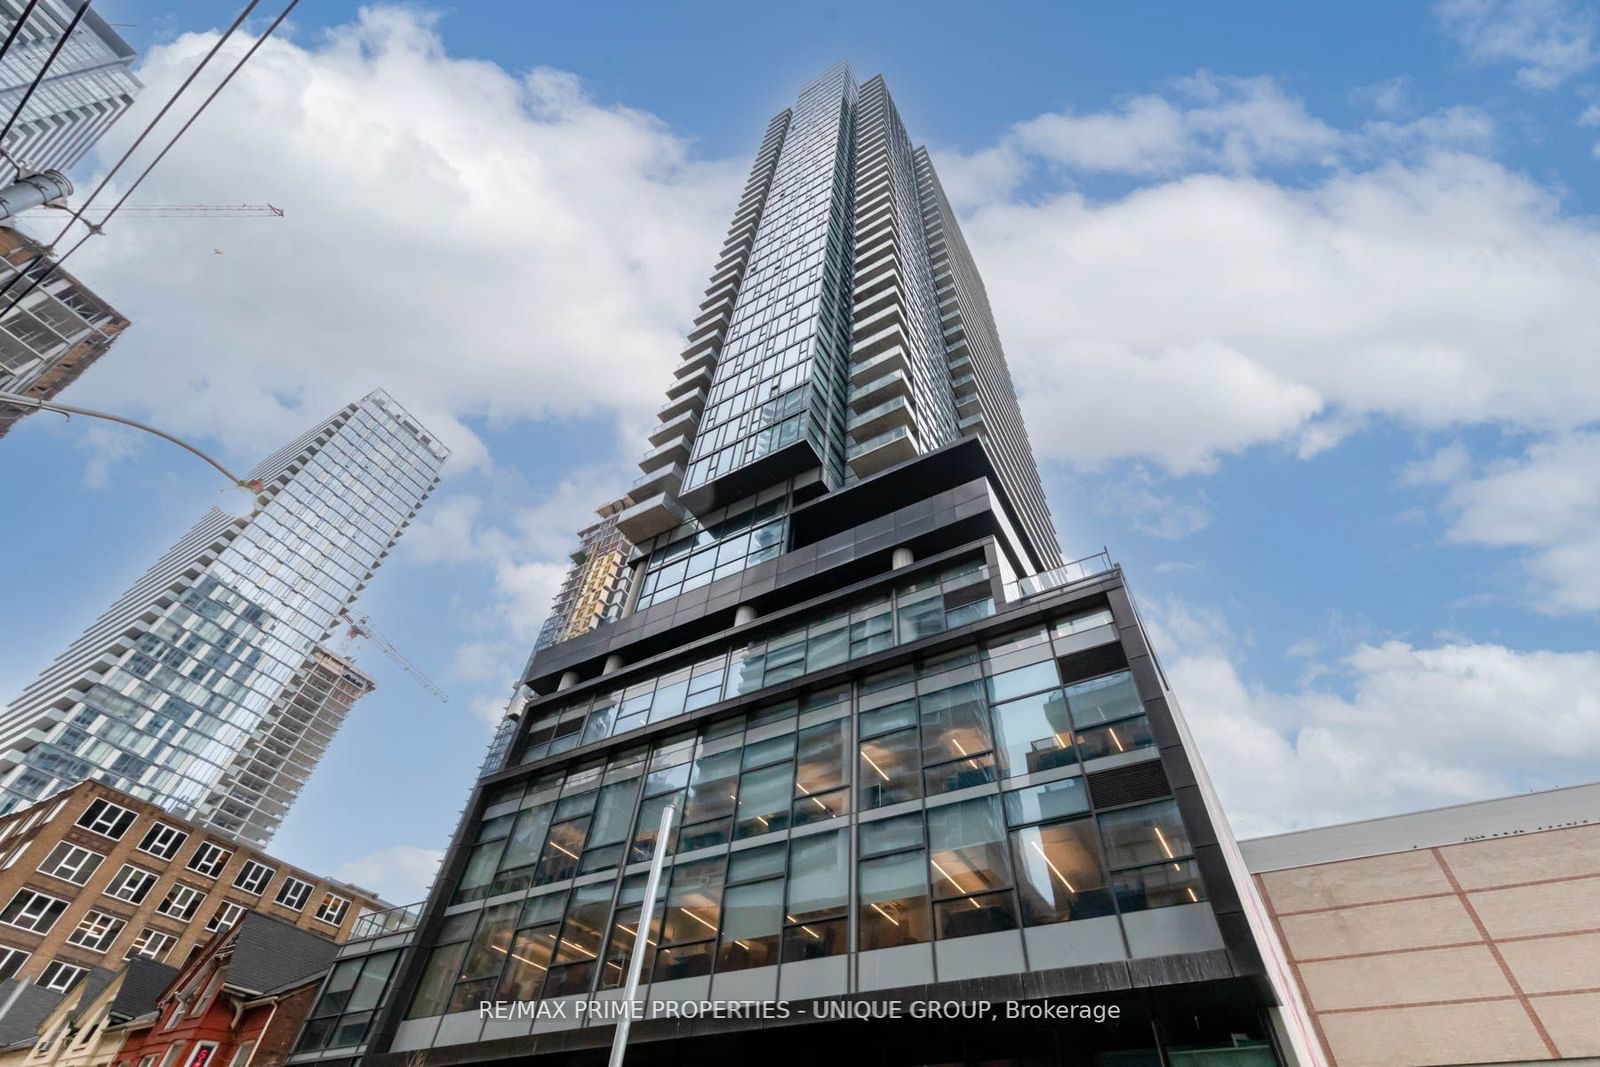
3510 - 290 Adelaide St W
Listing History
Unit Highlights
Utilities Included
Utility Type
- Air Conditioning
- Central Air
- Heat Source
- Gas
- Heating
- Forced Air
Room Dimensions
About this Listing
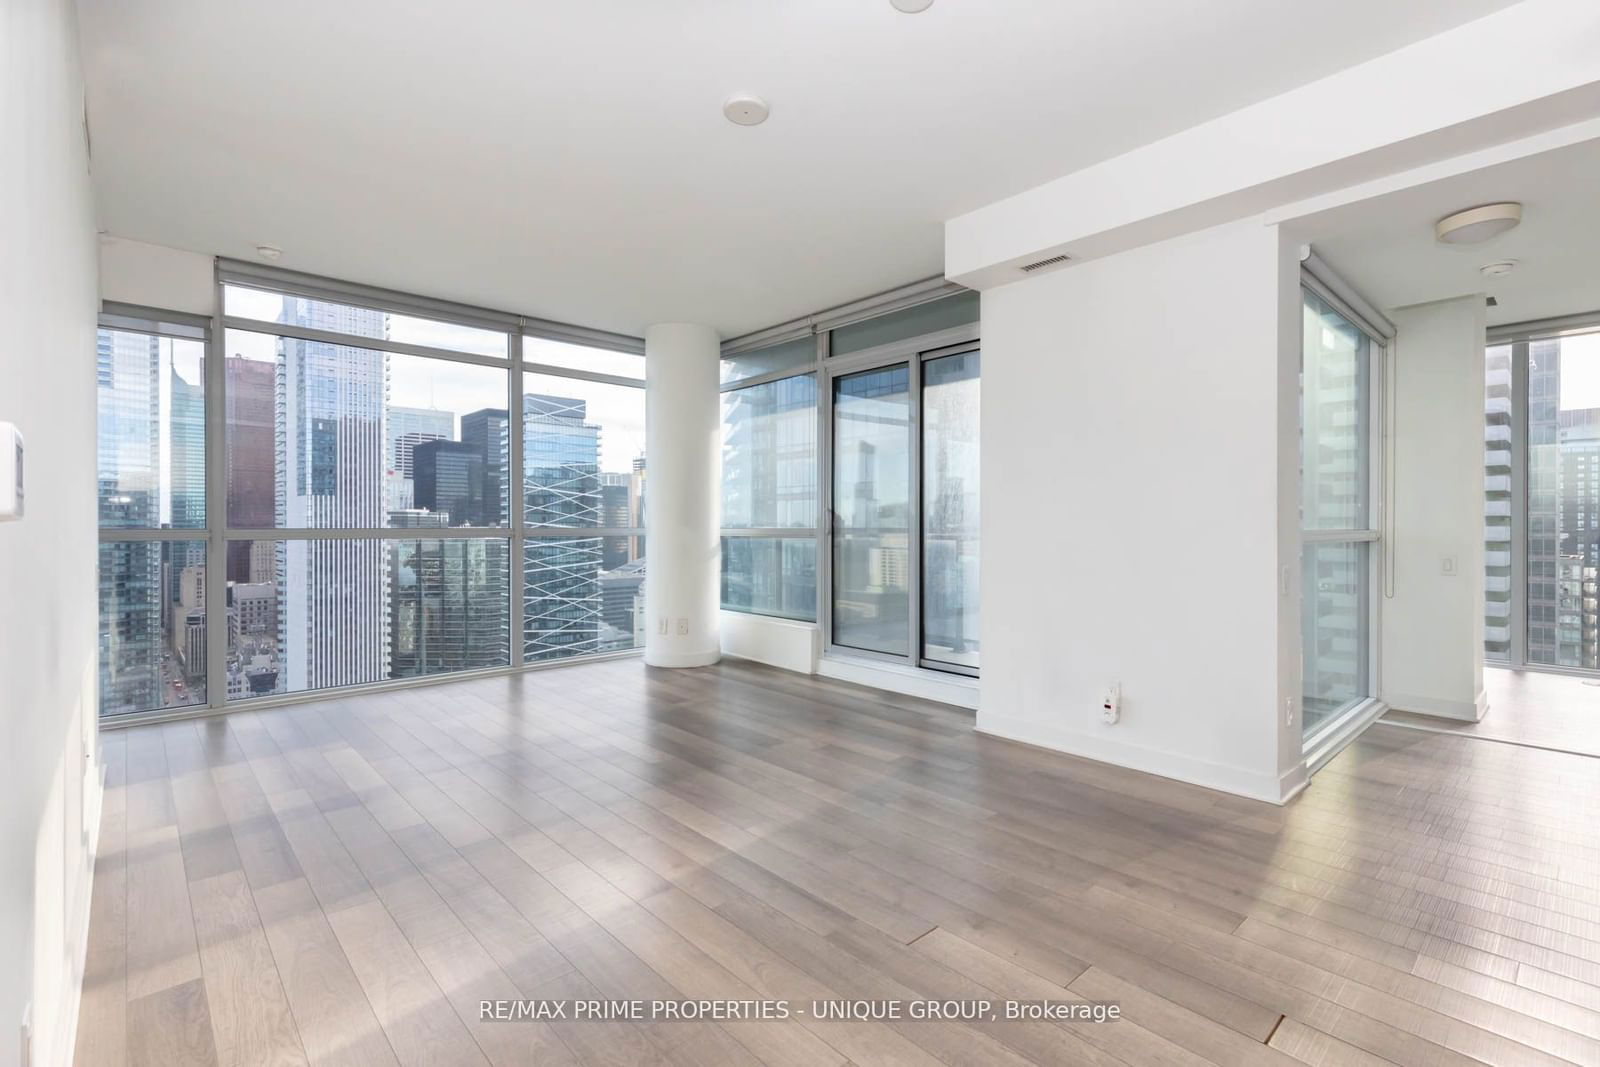
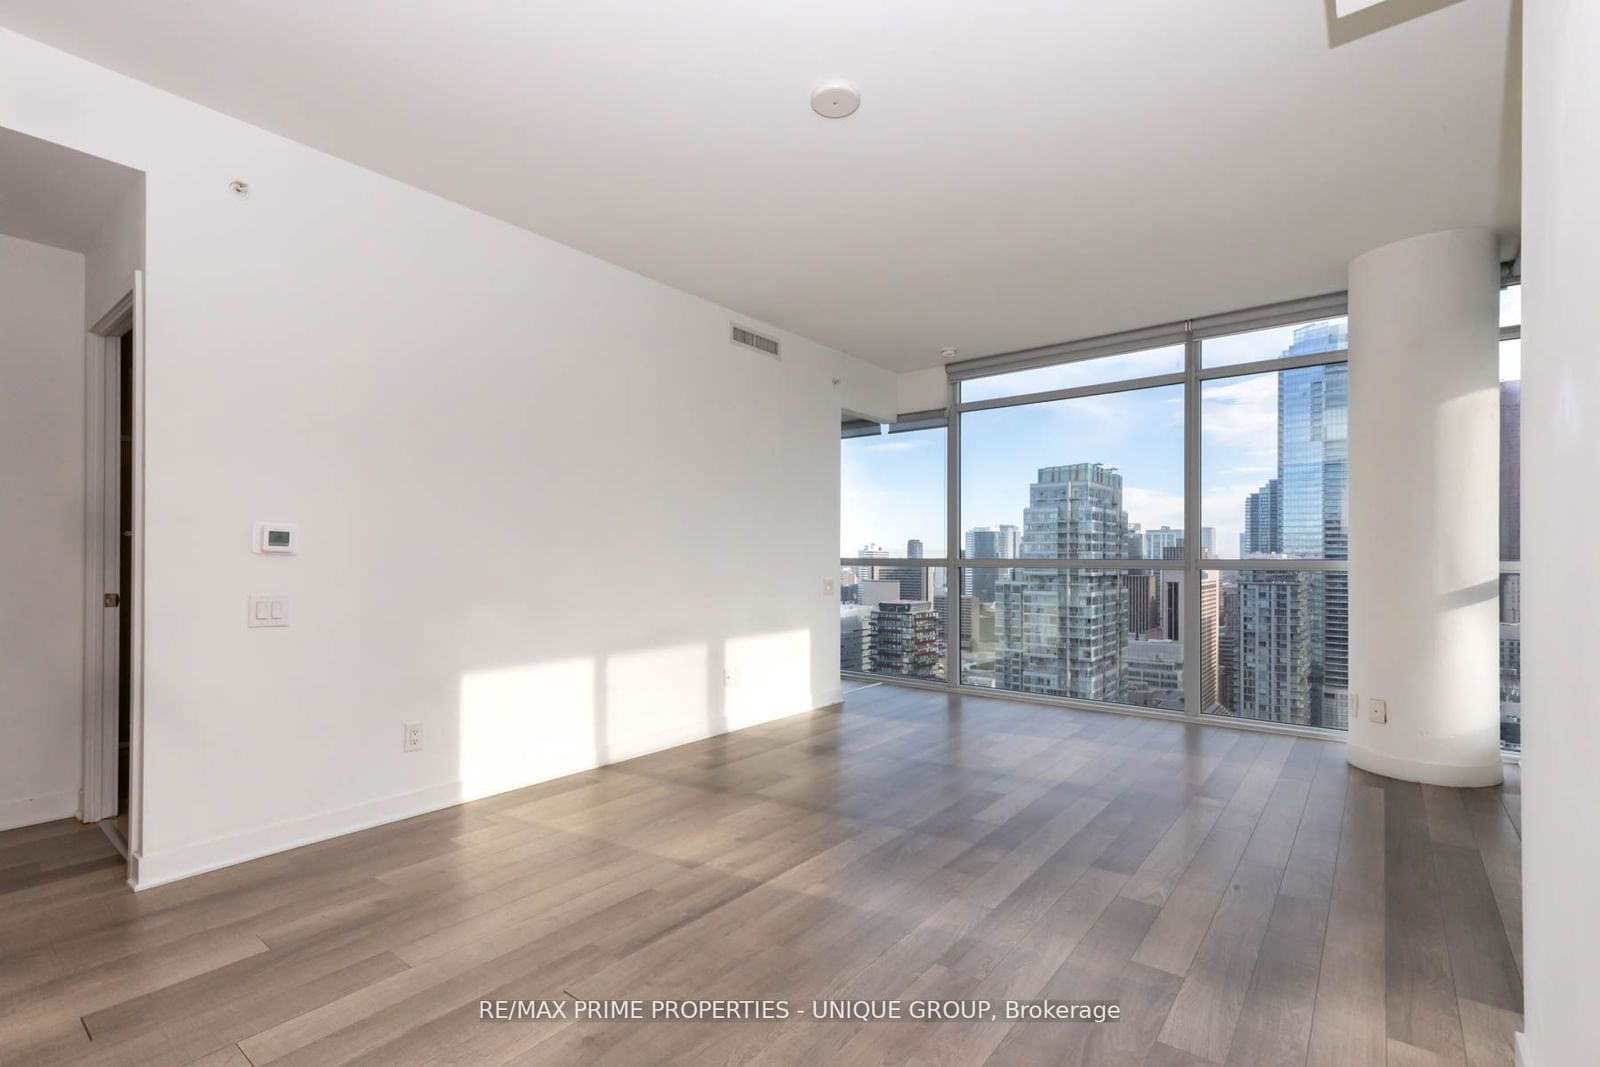
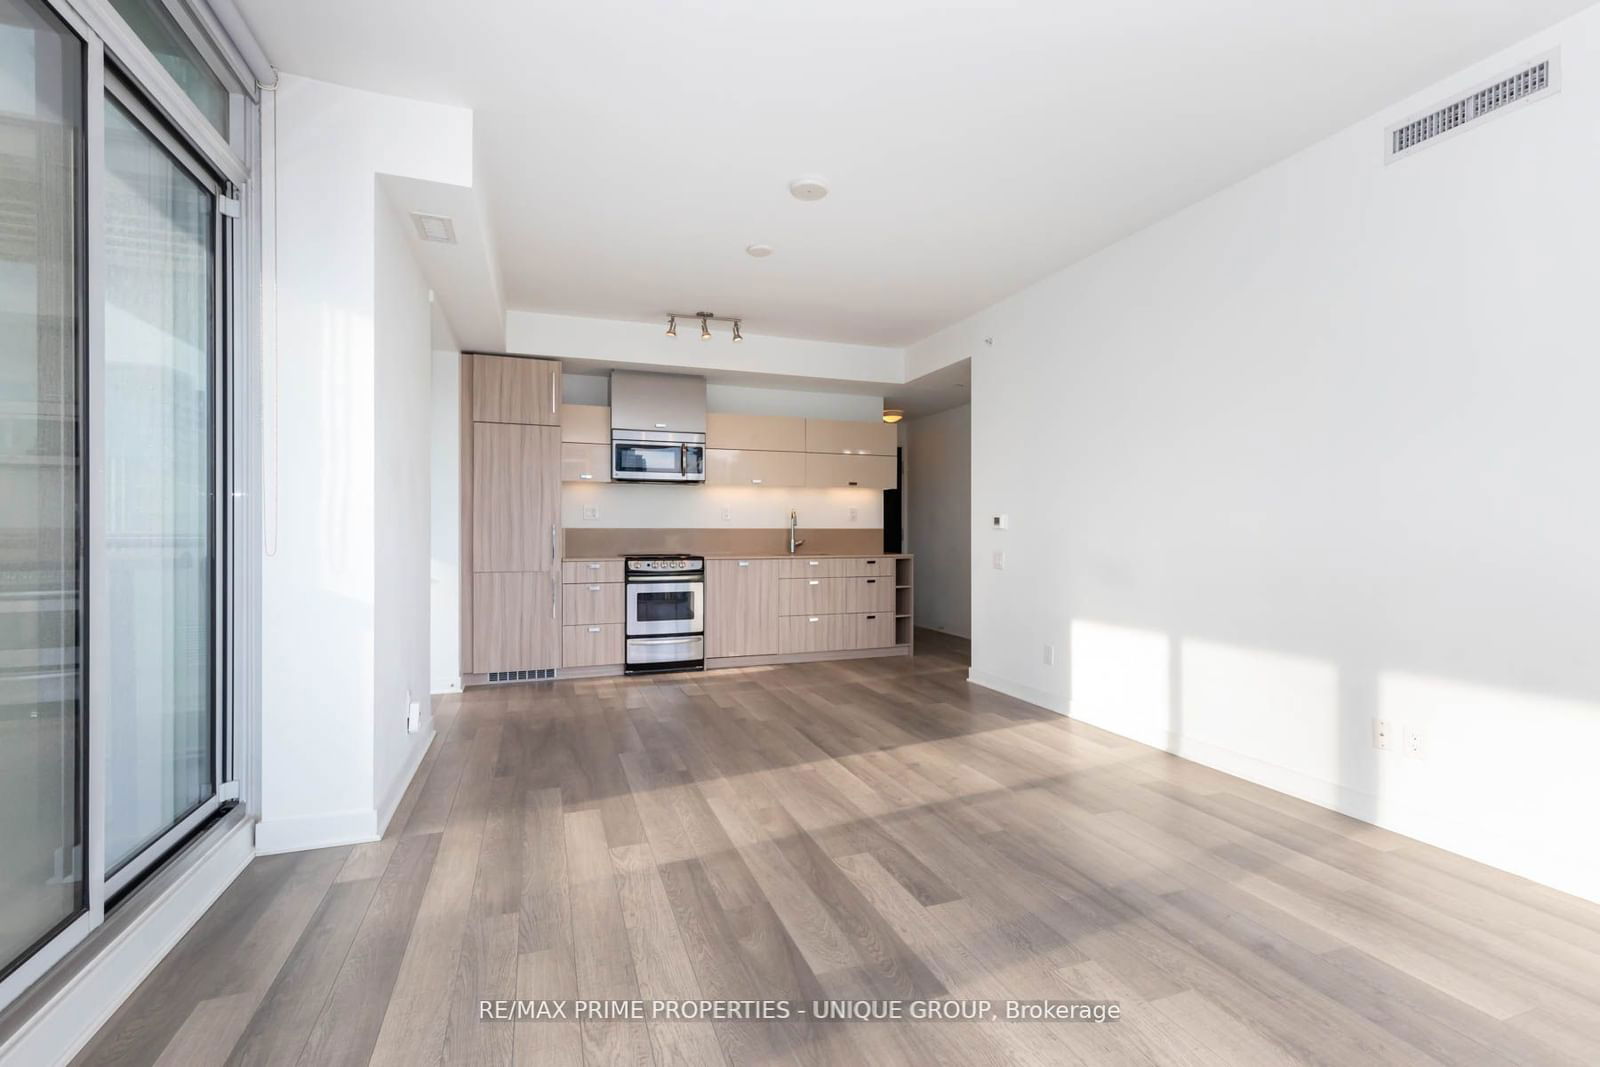
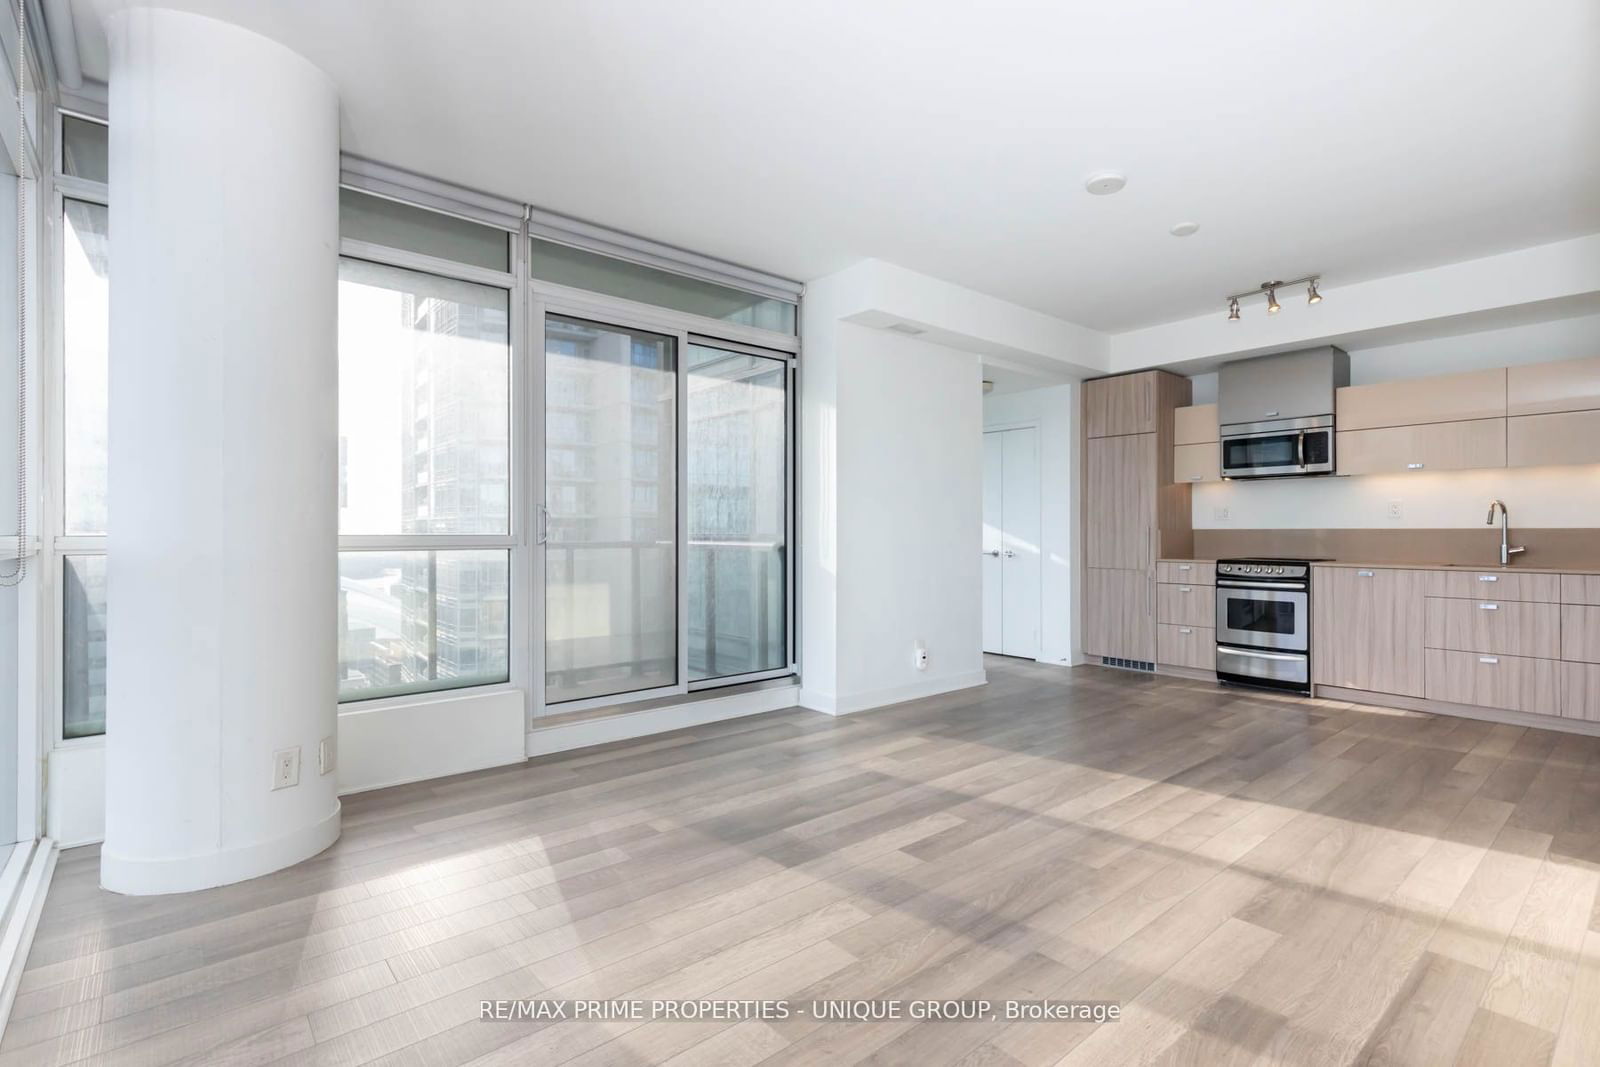
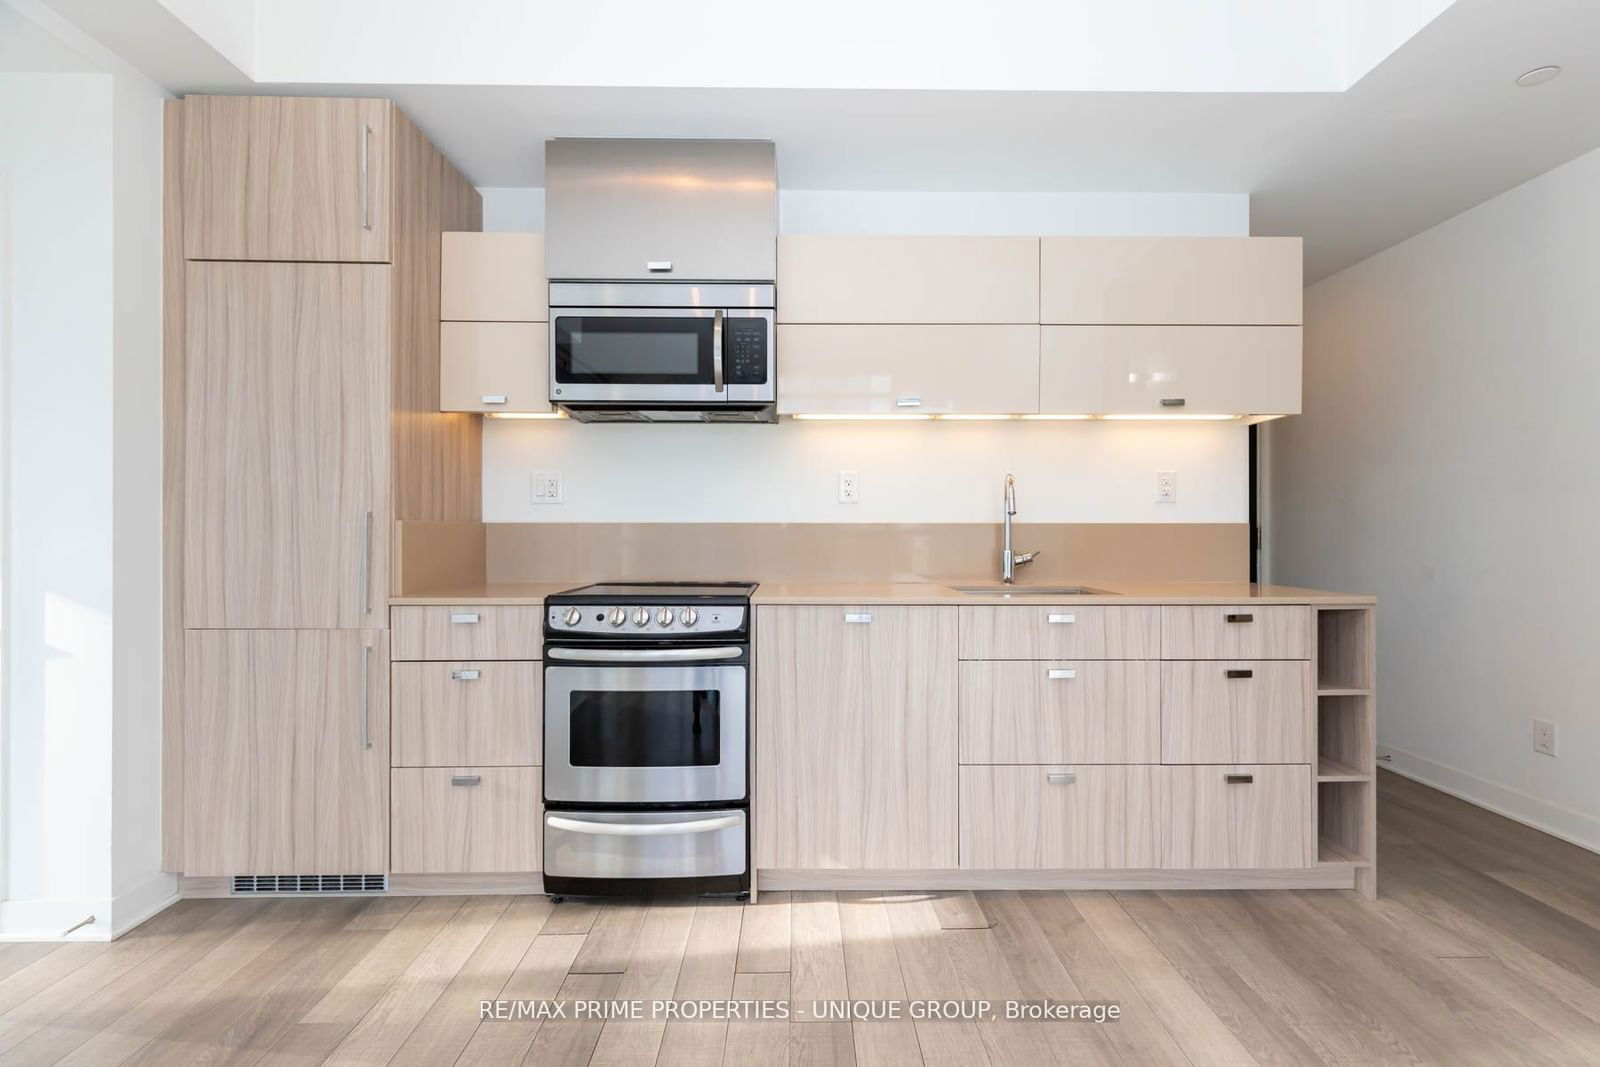
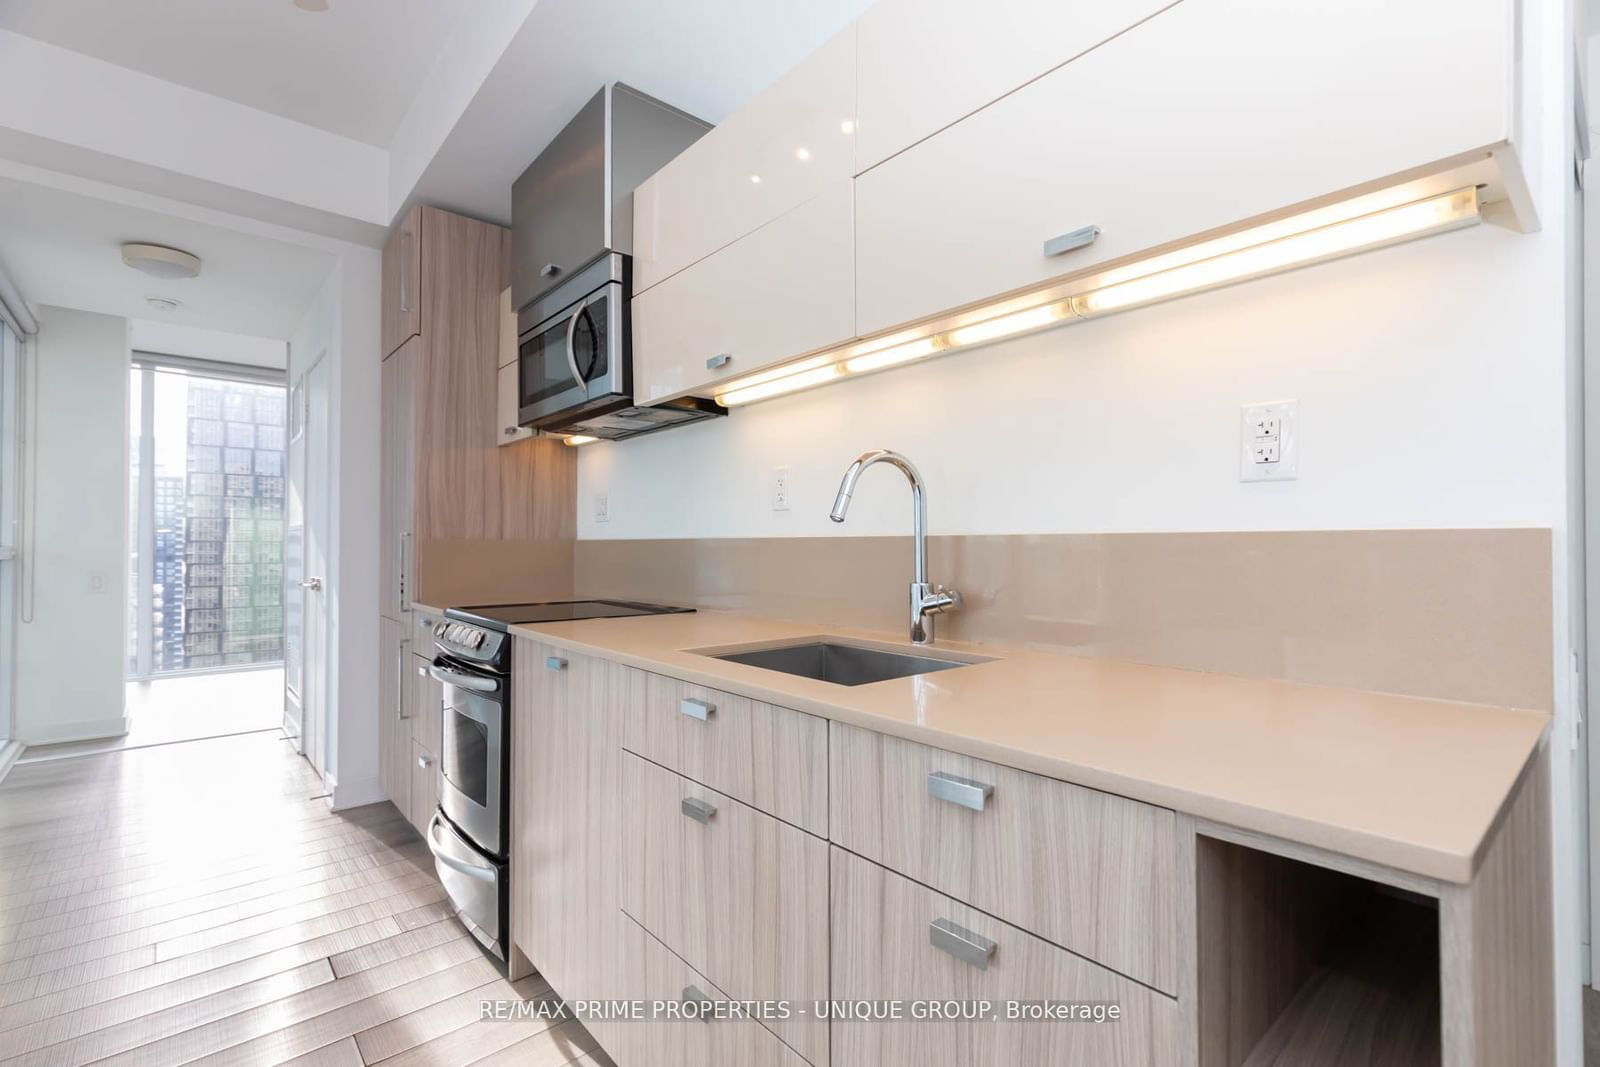
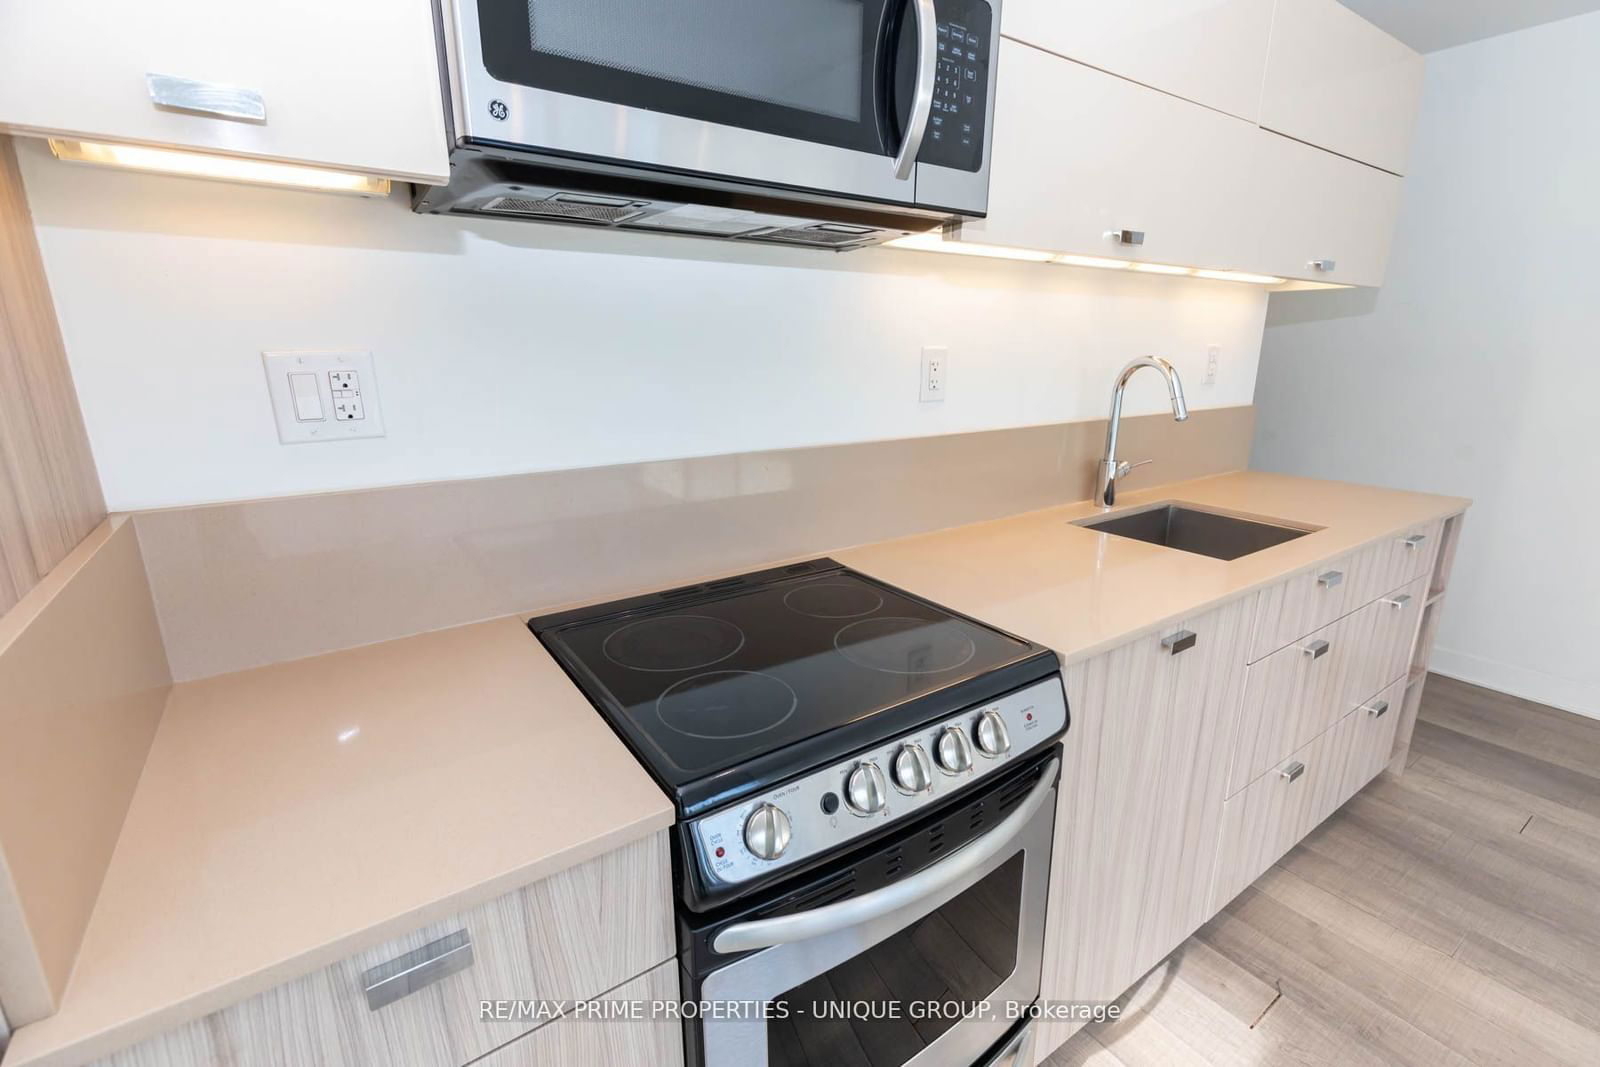
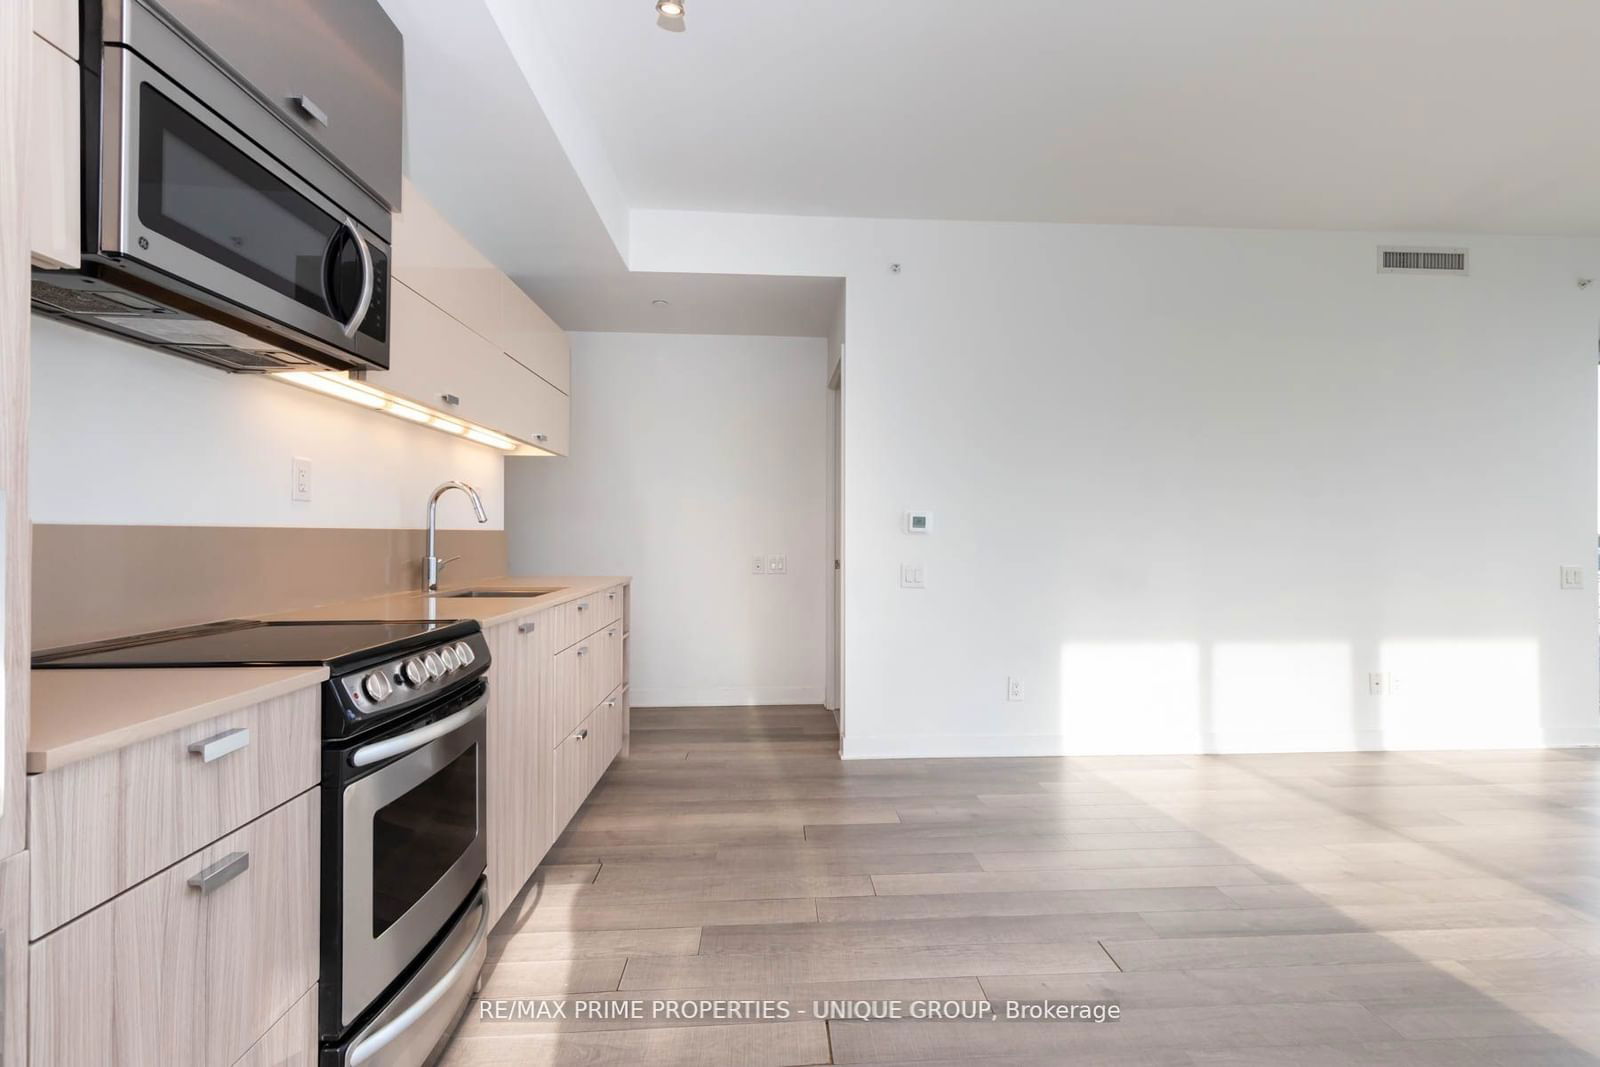
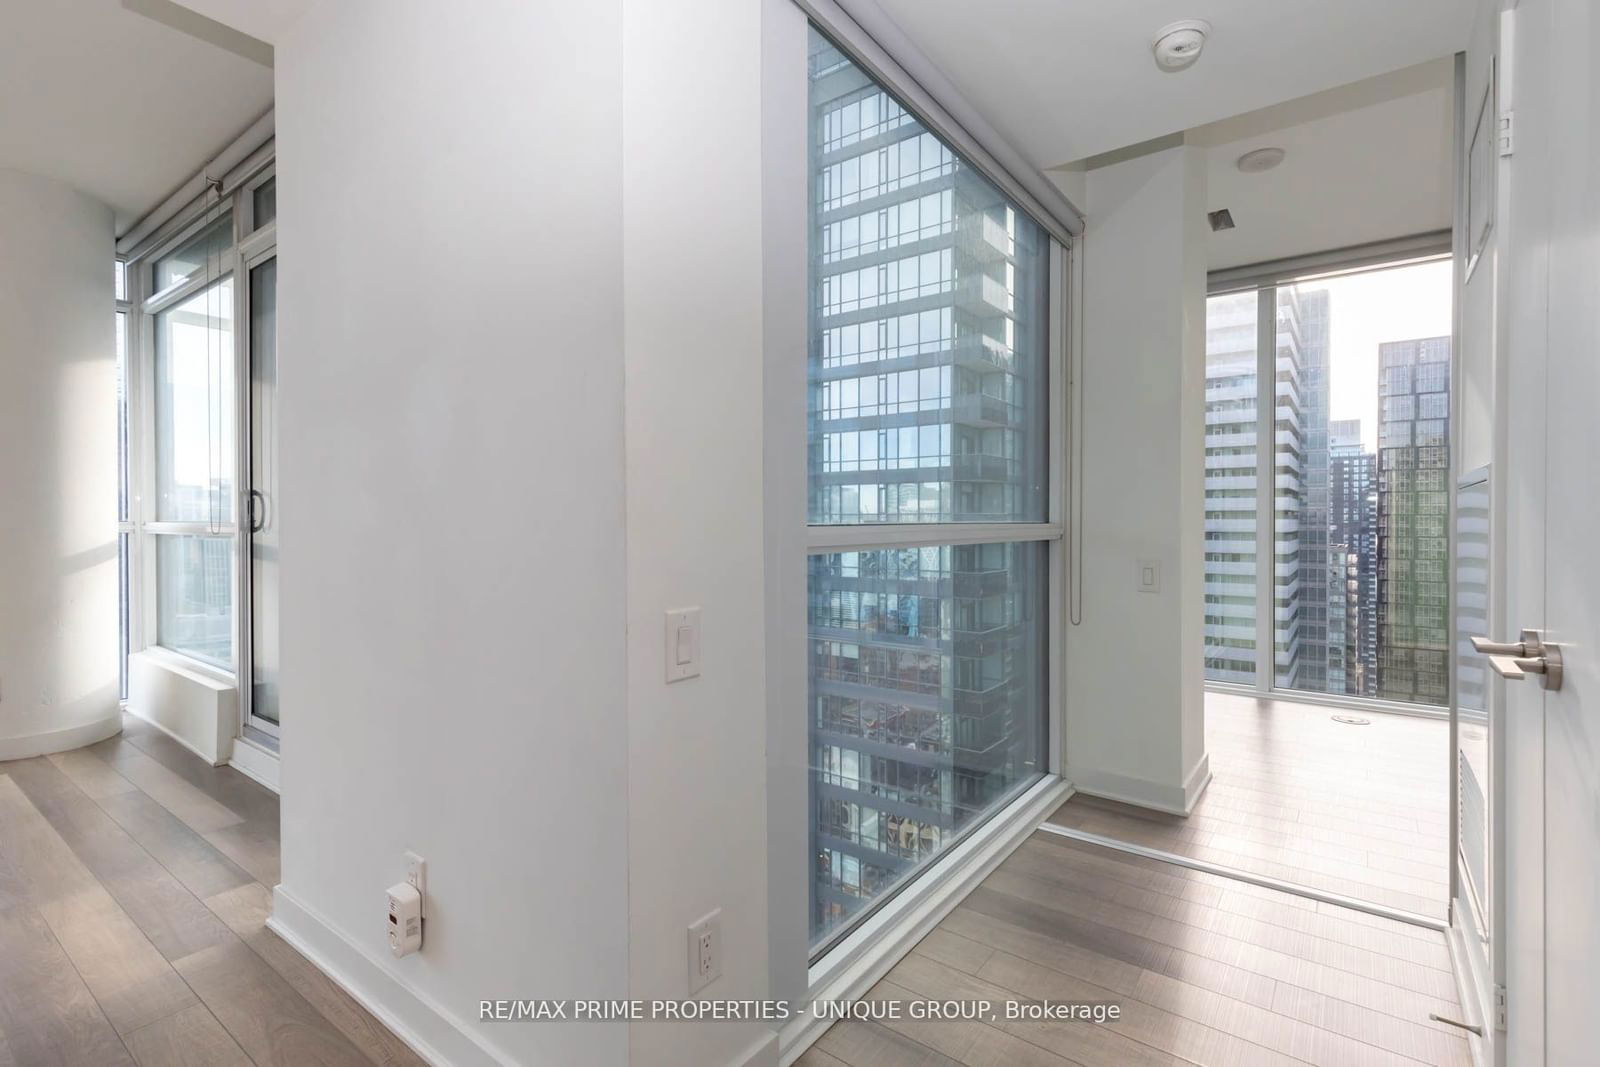
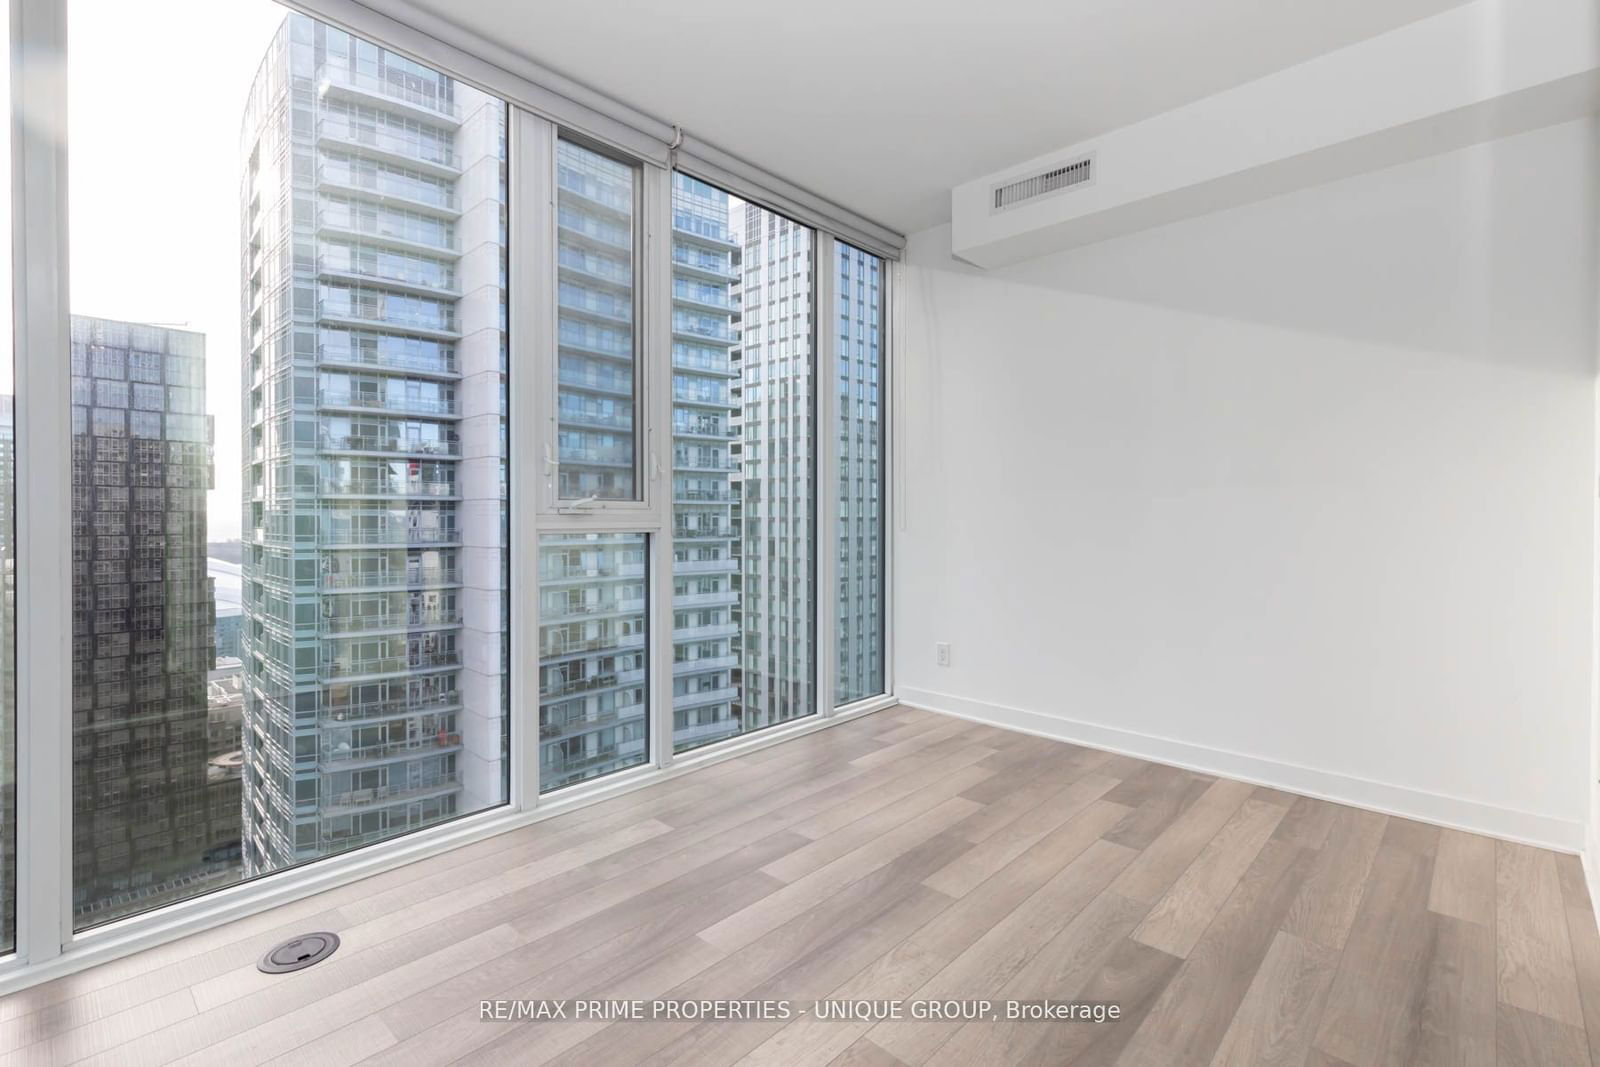
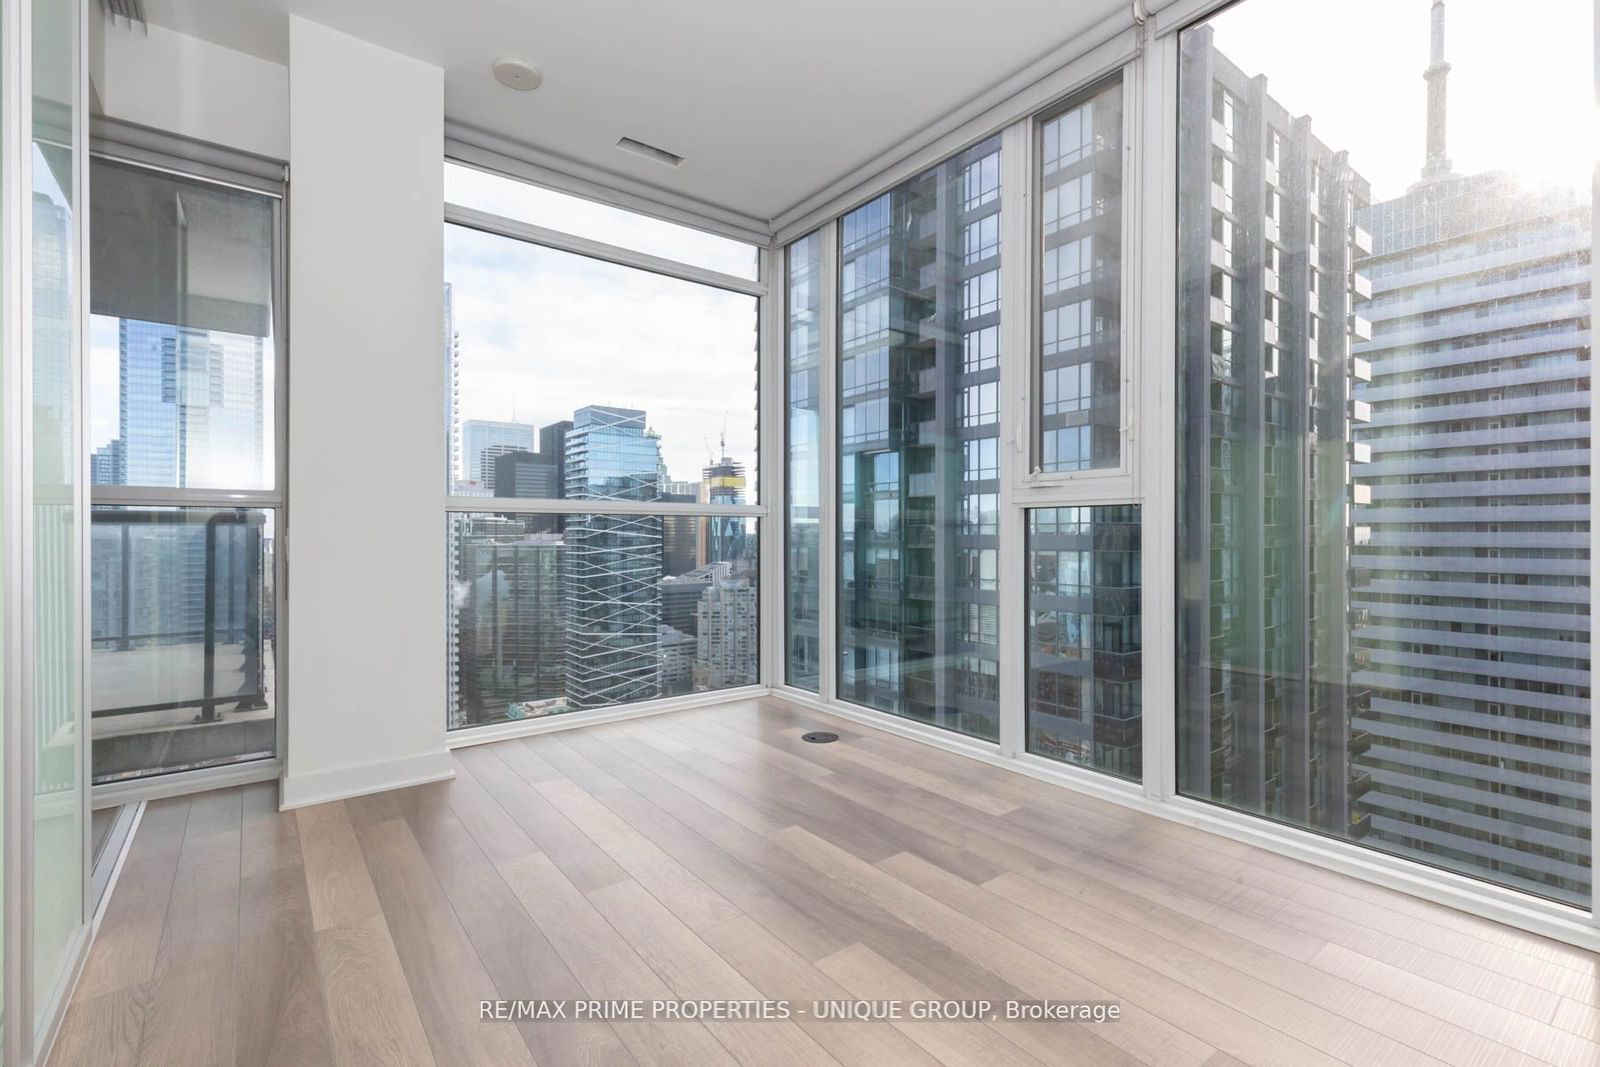
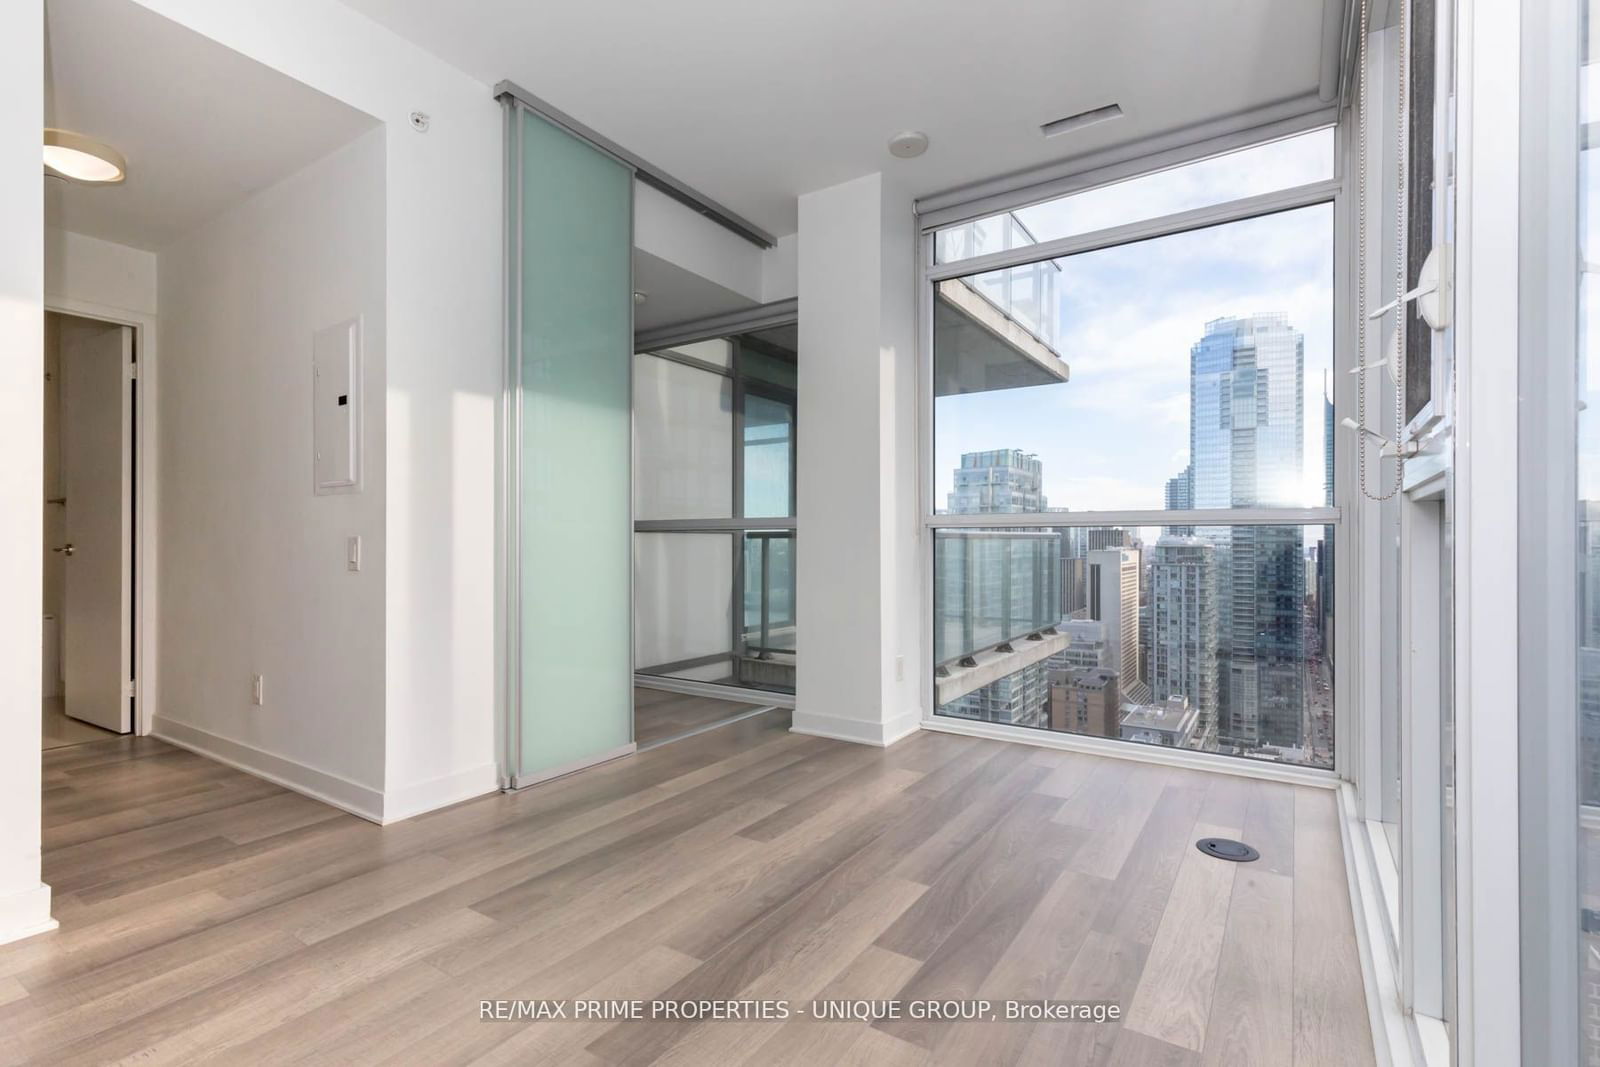
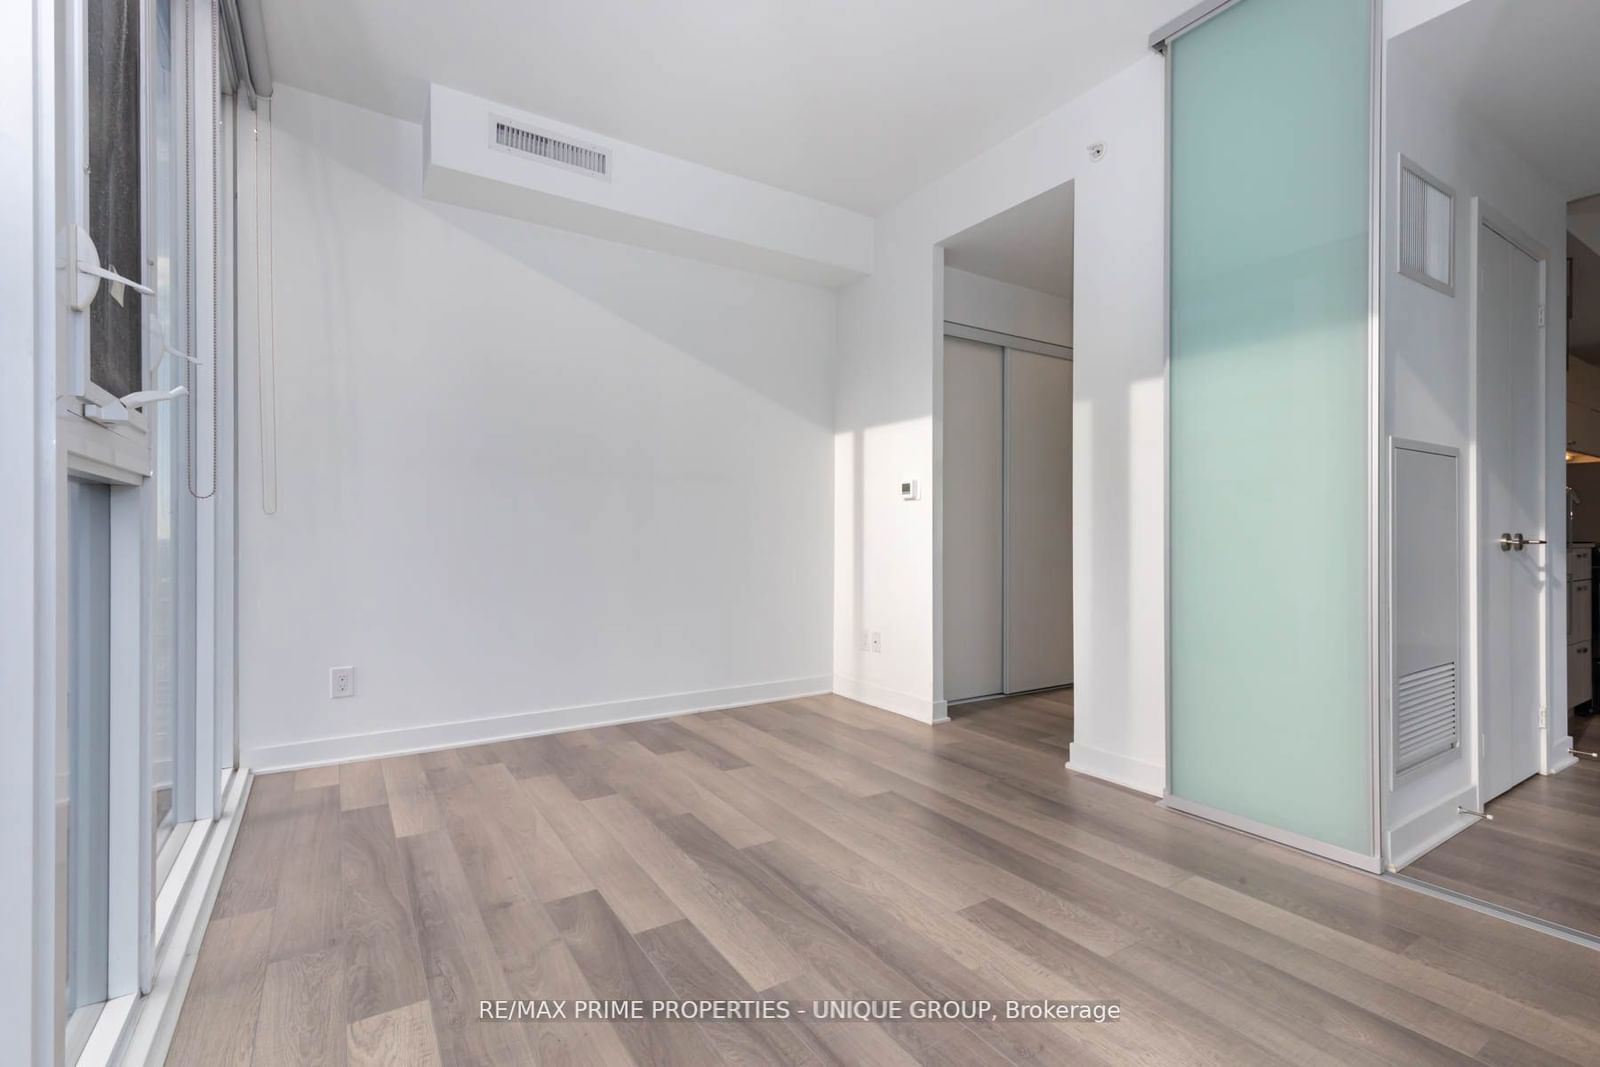
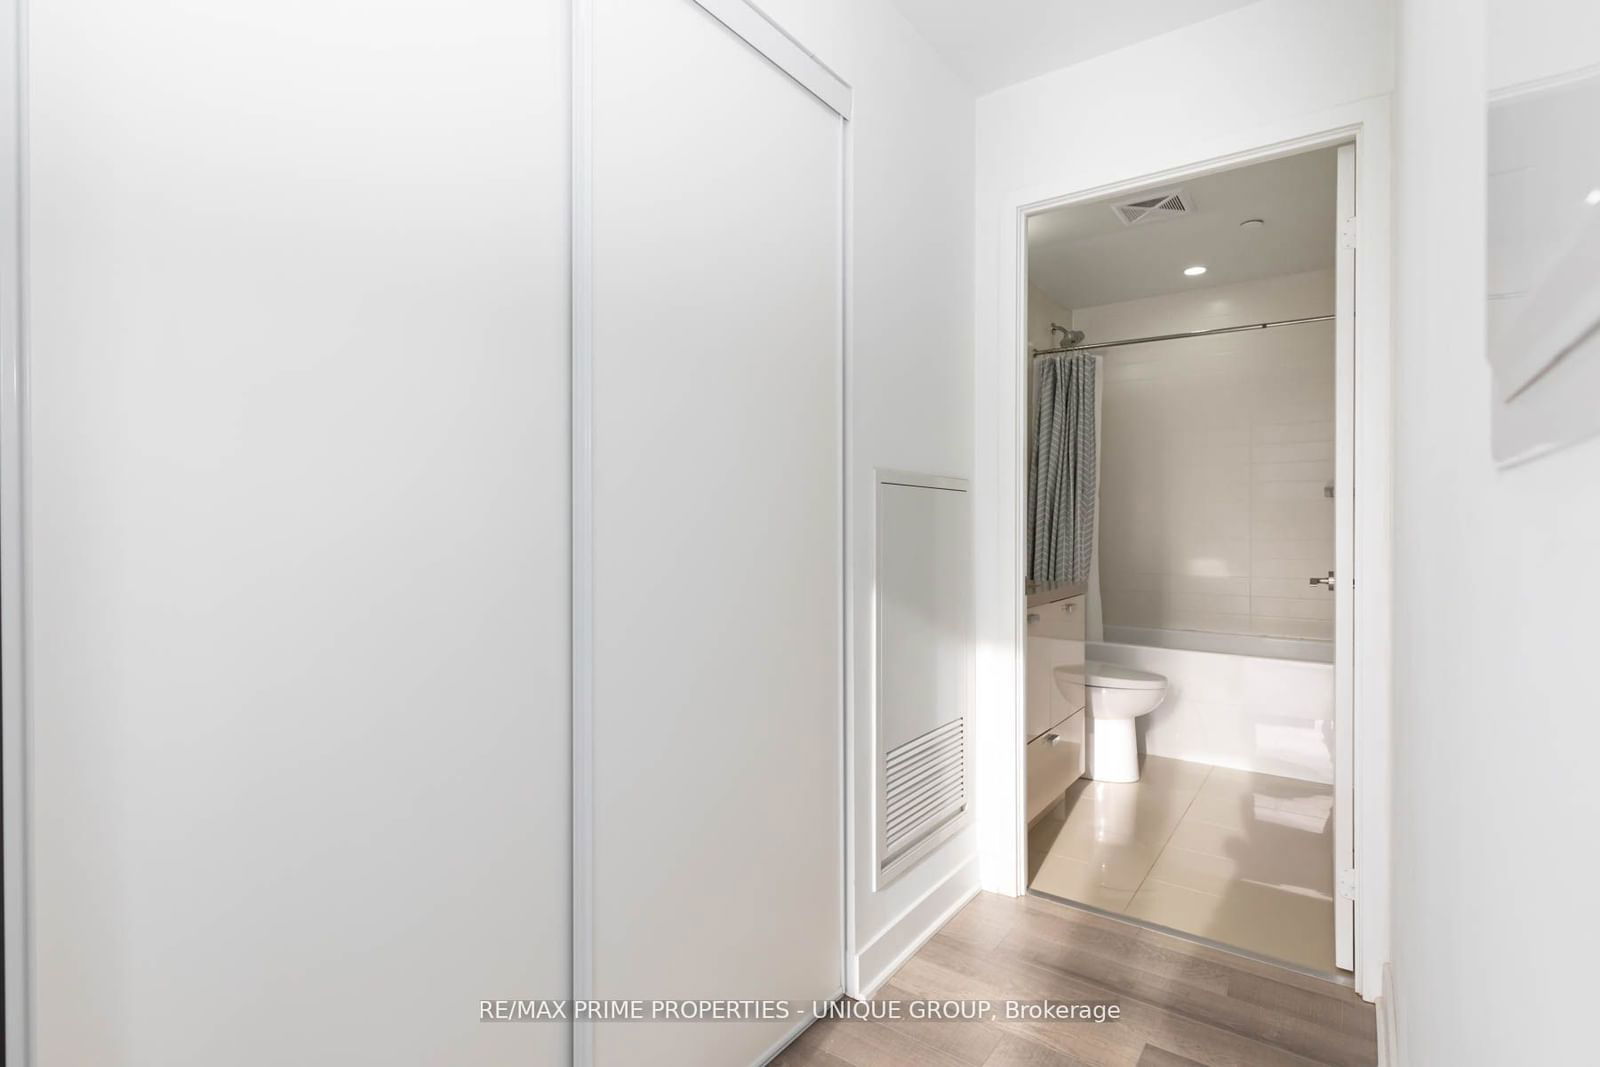
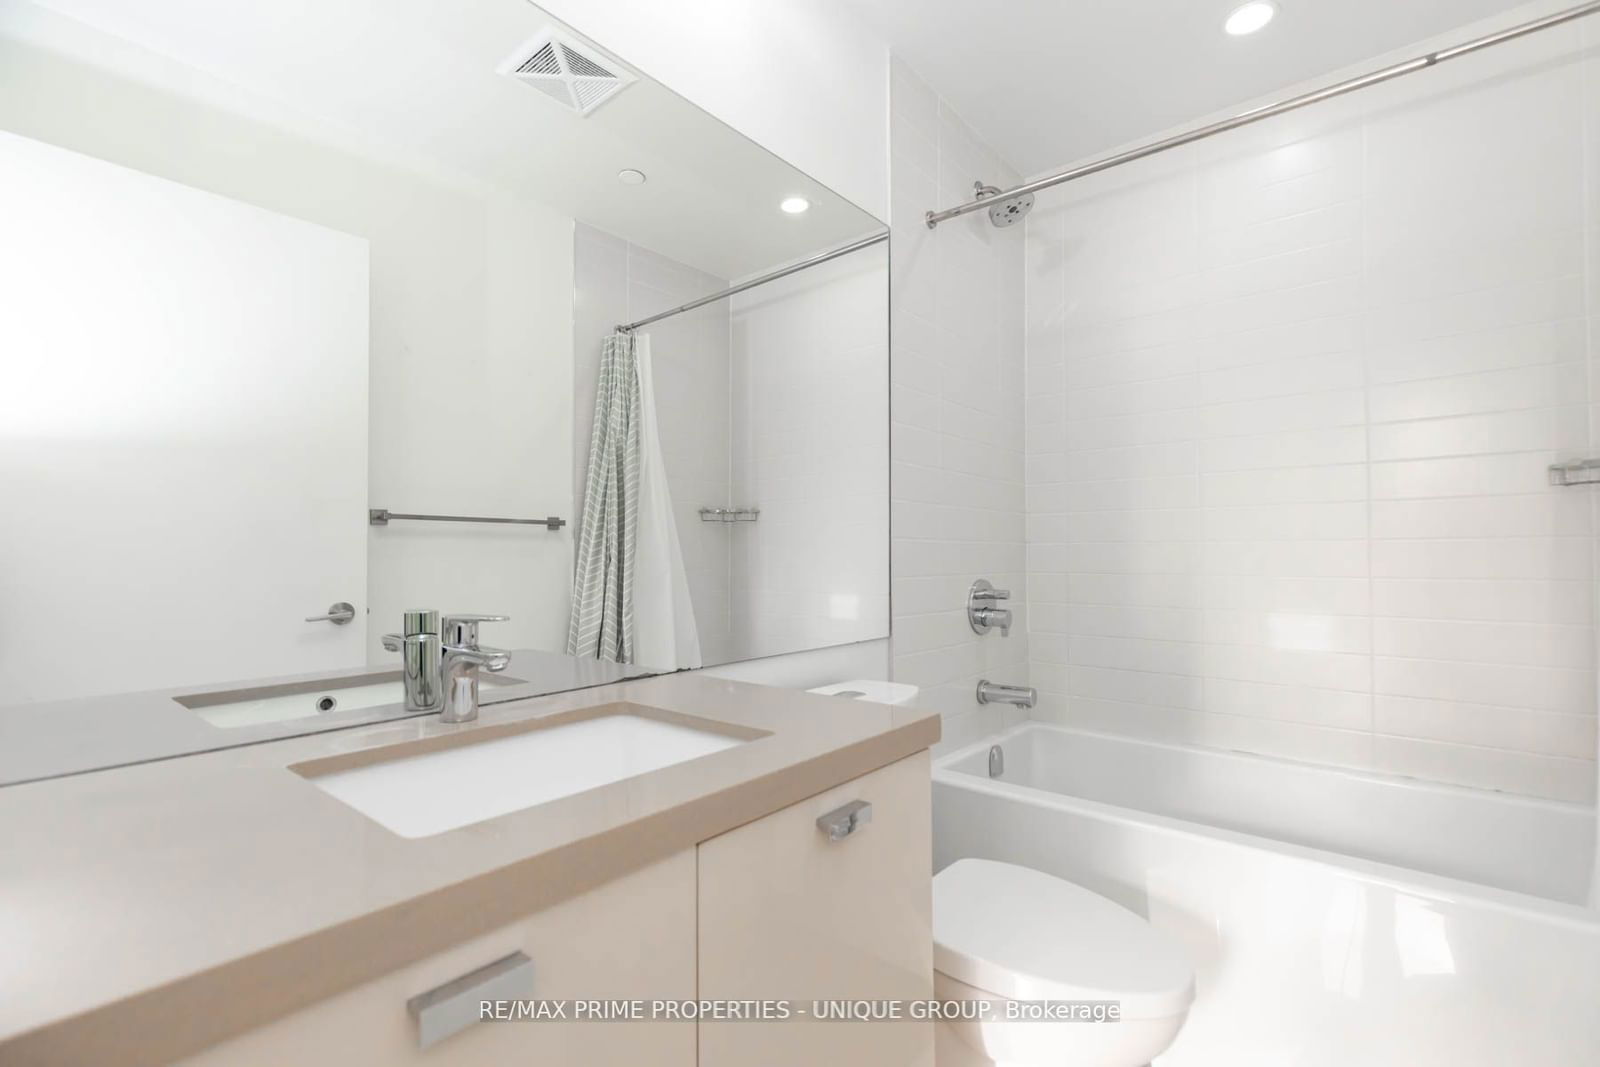
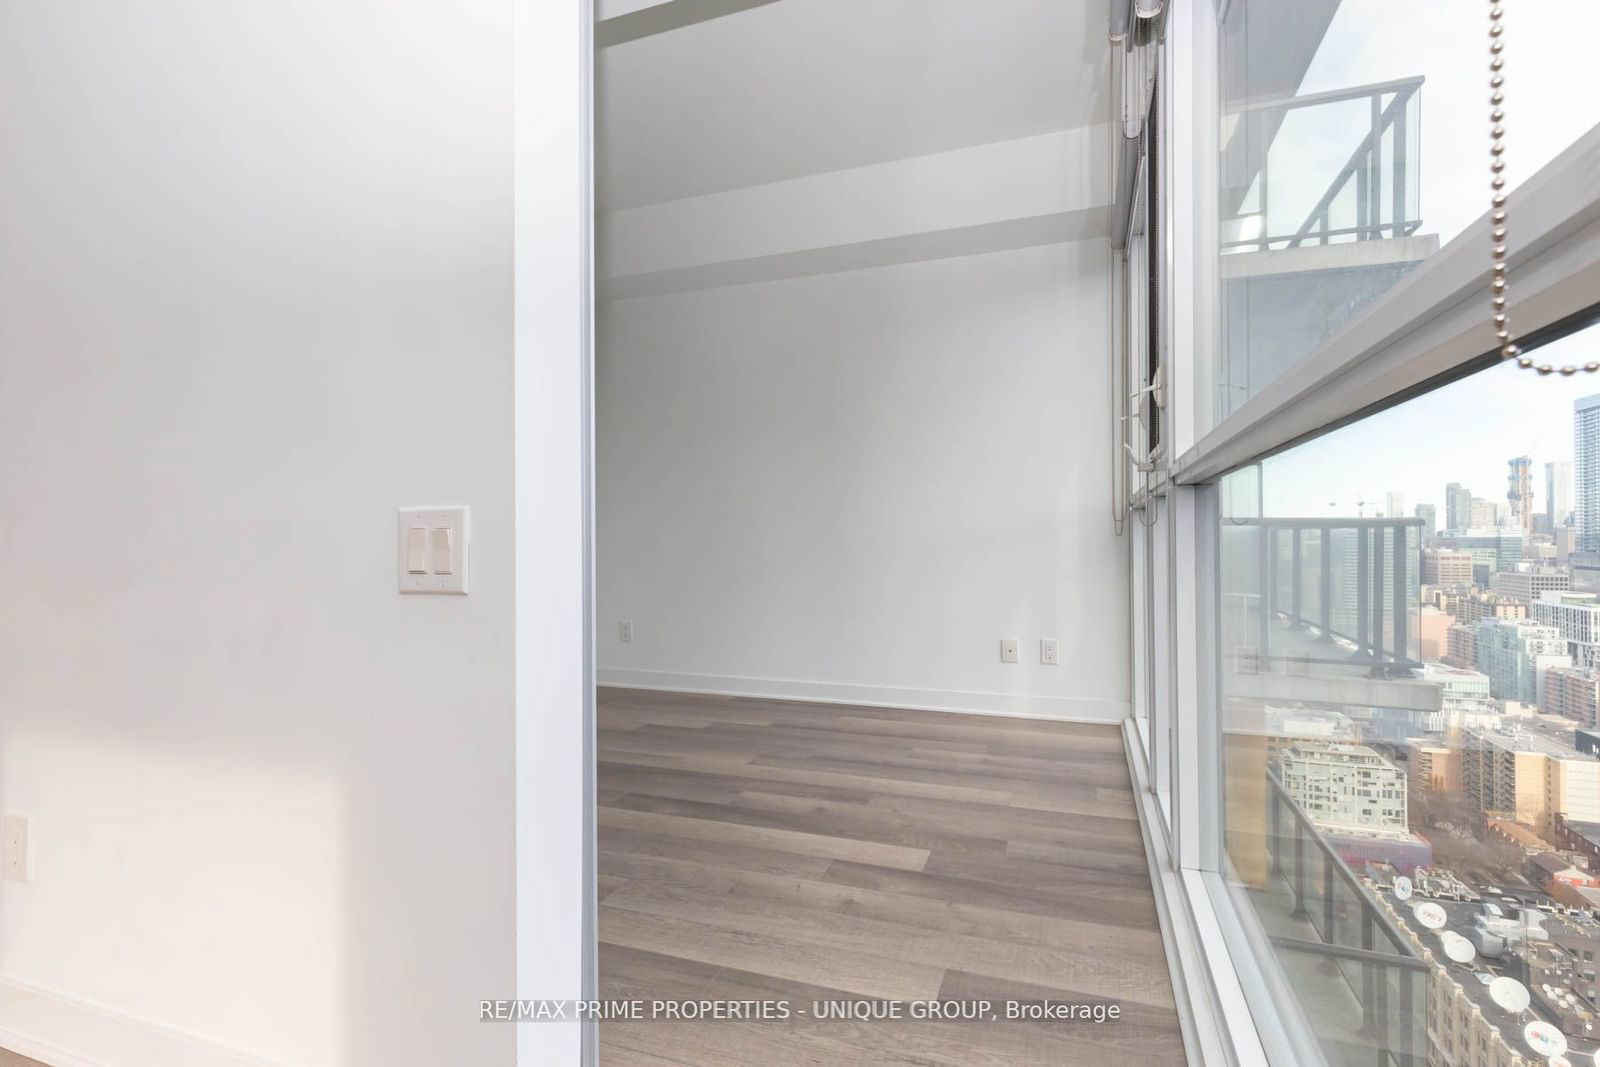
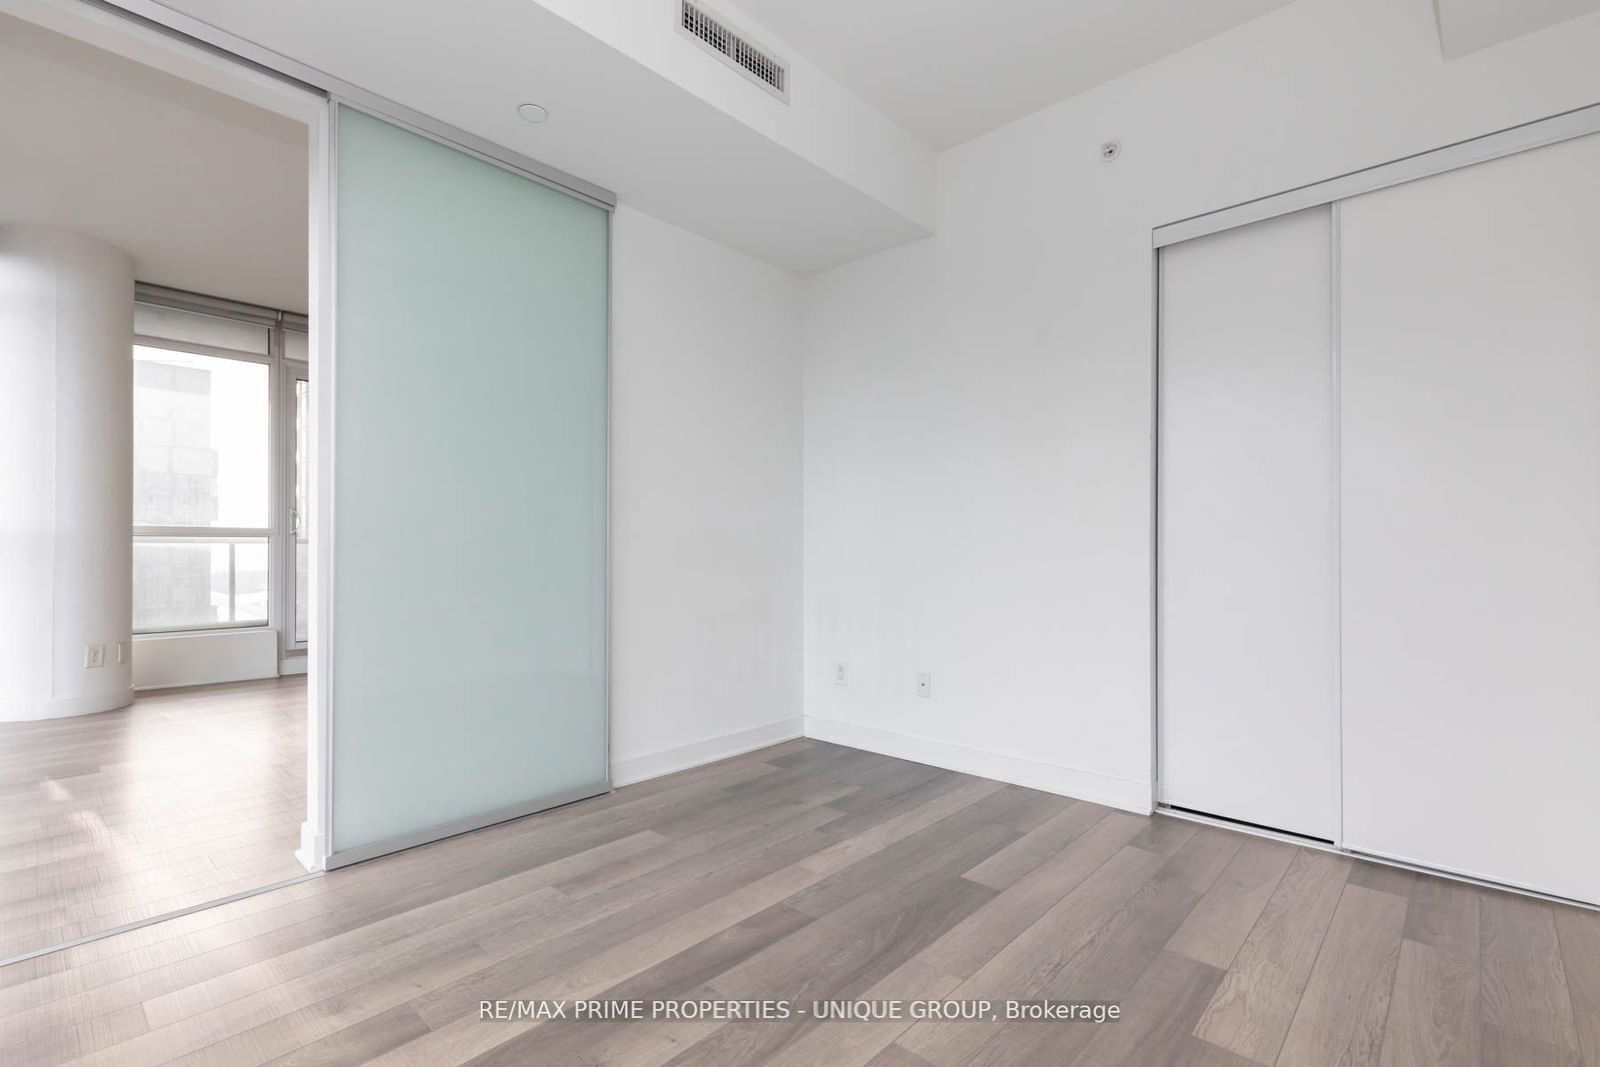
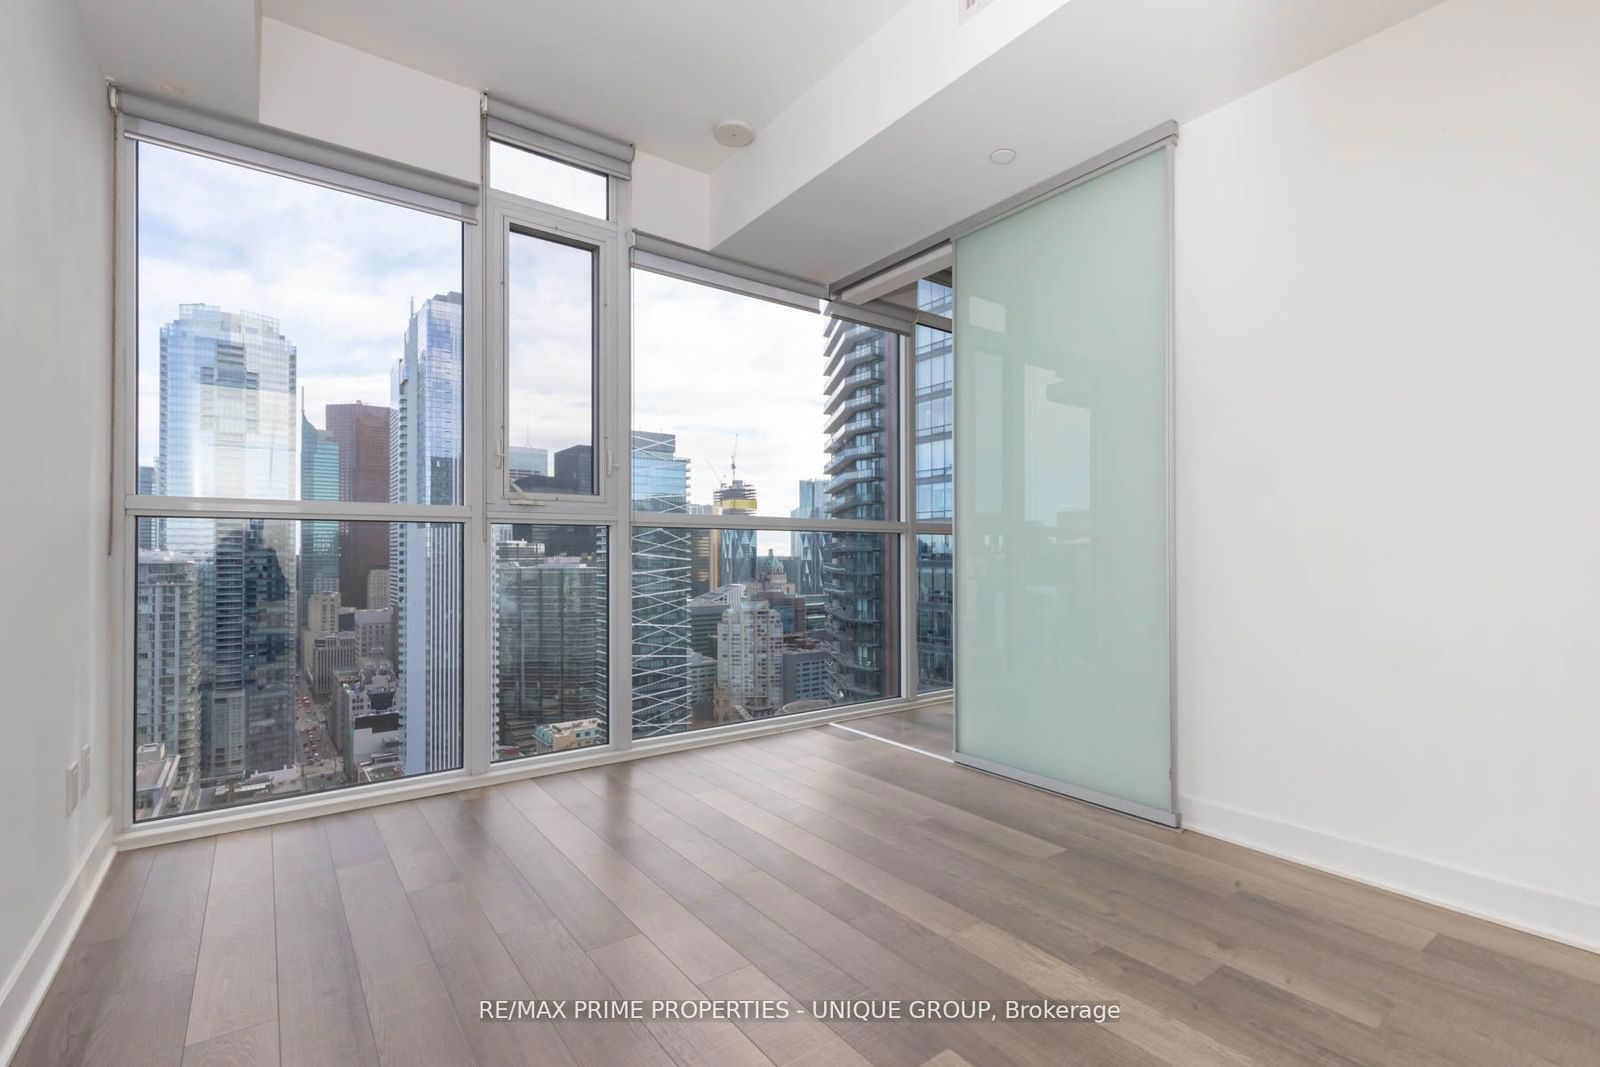
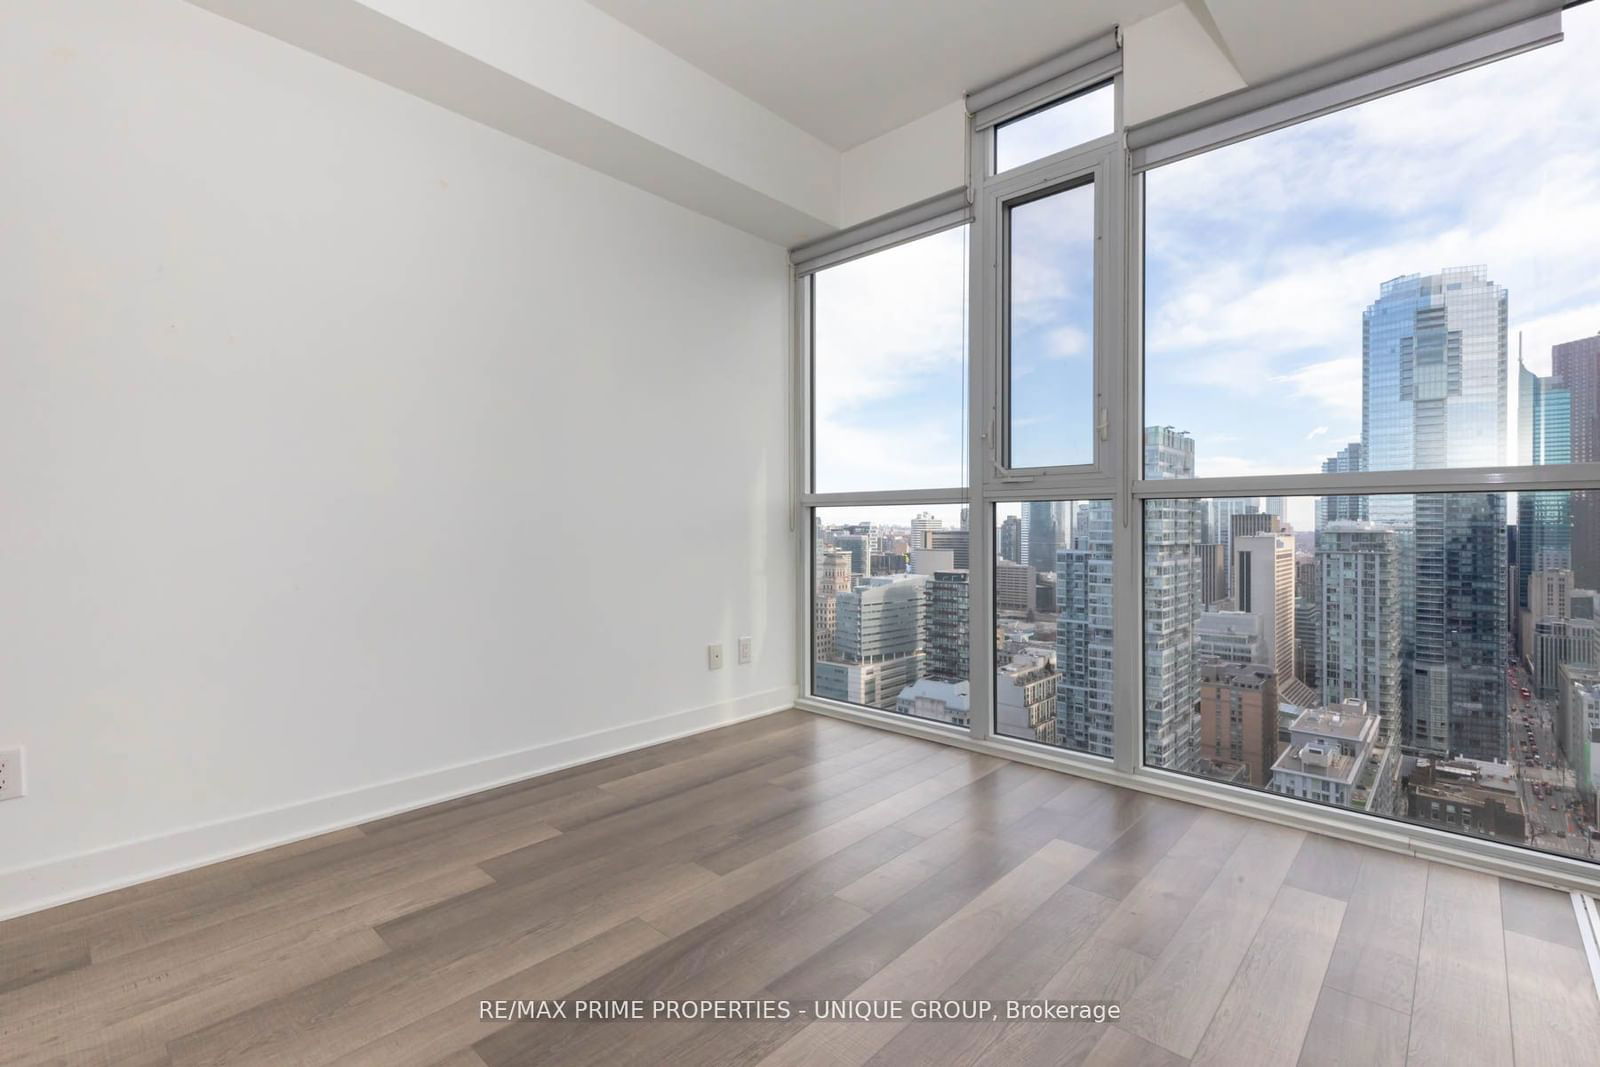
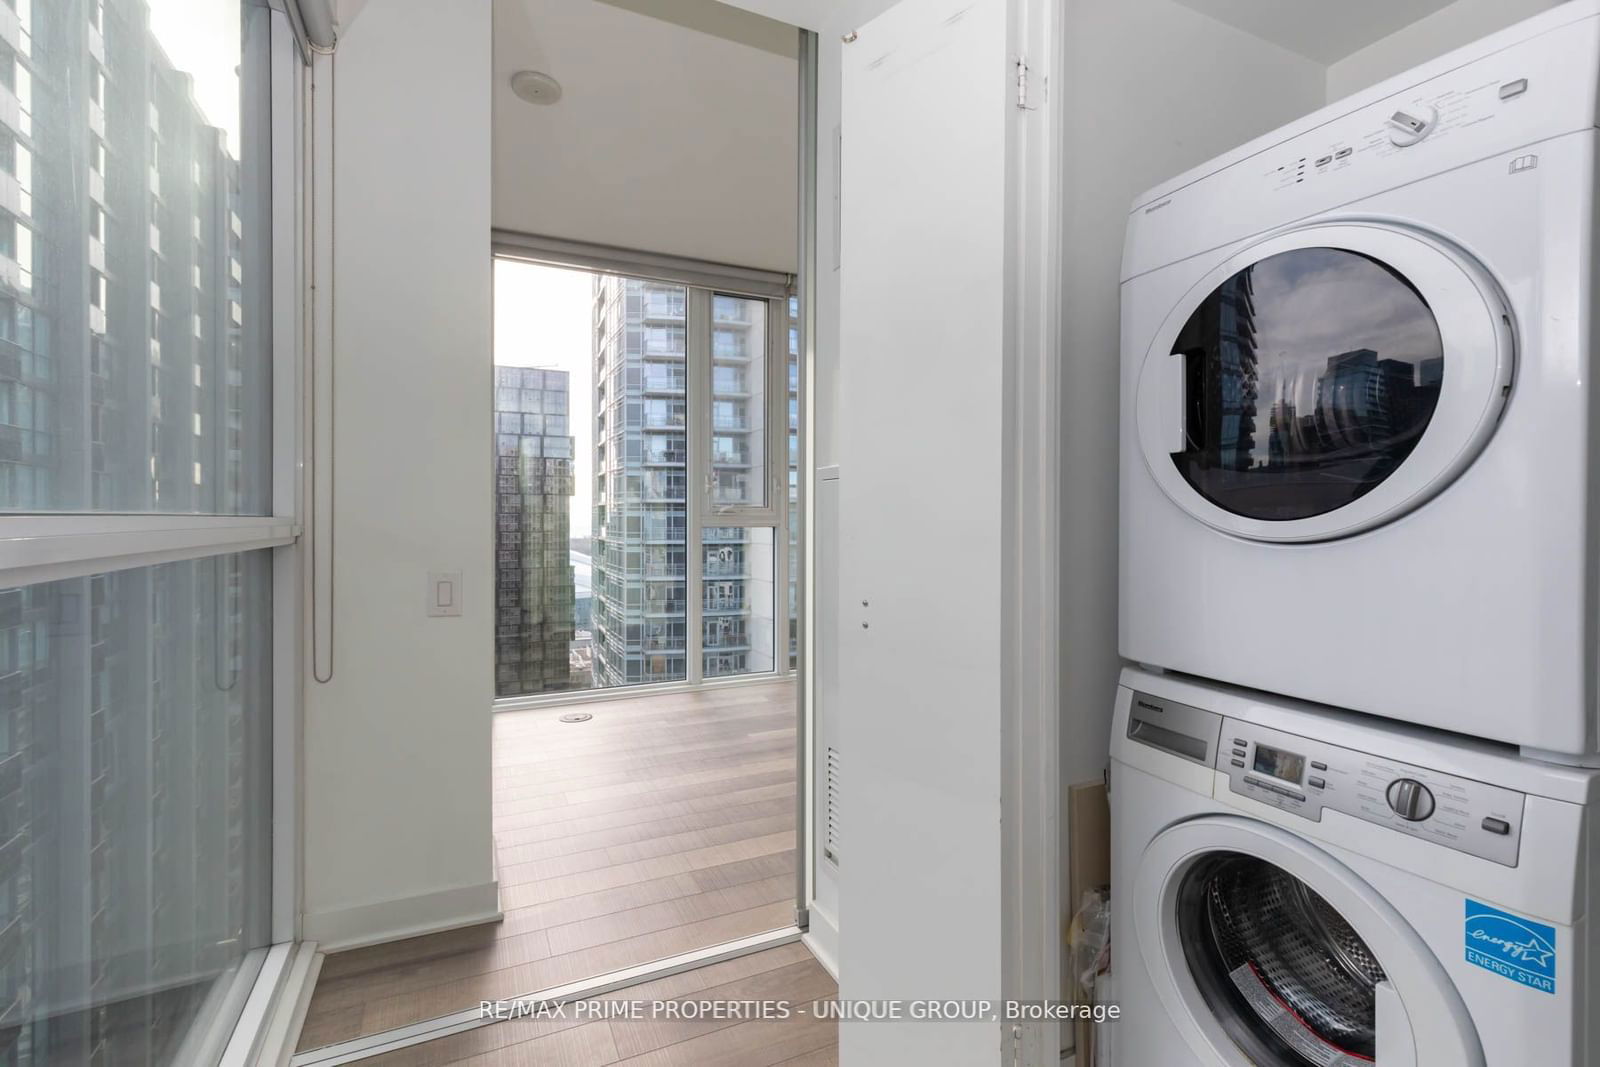
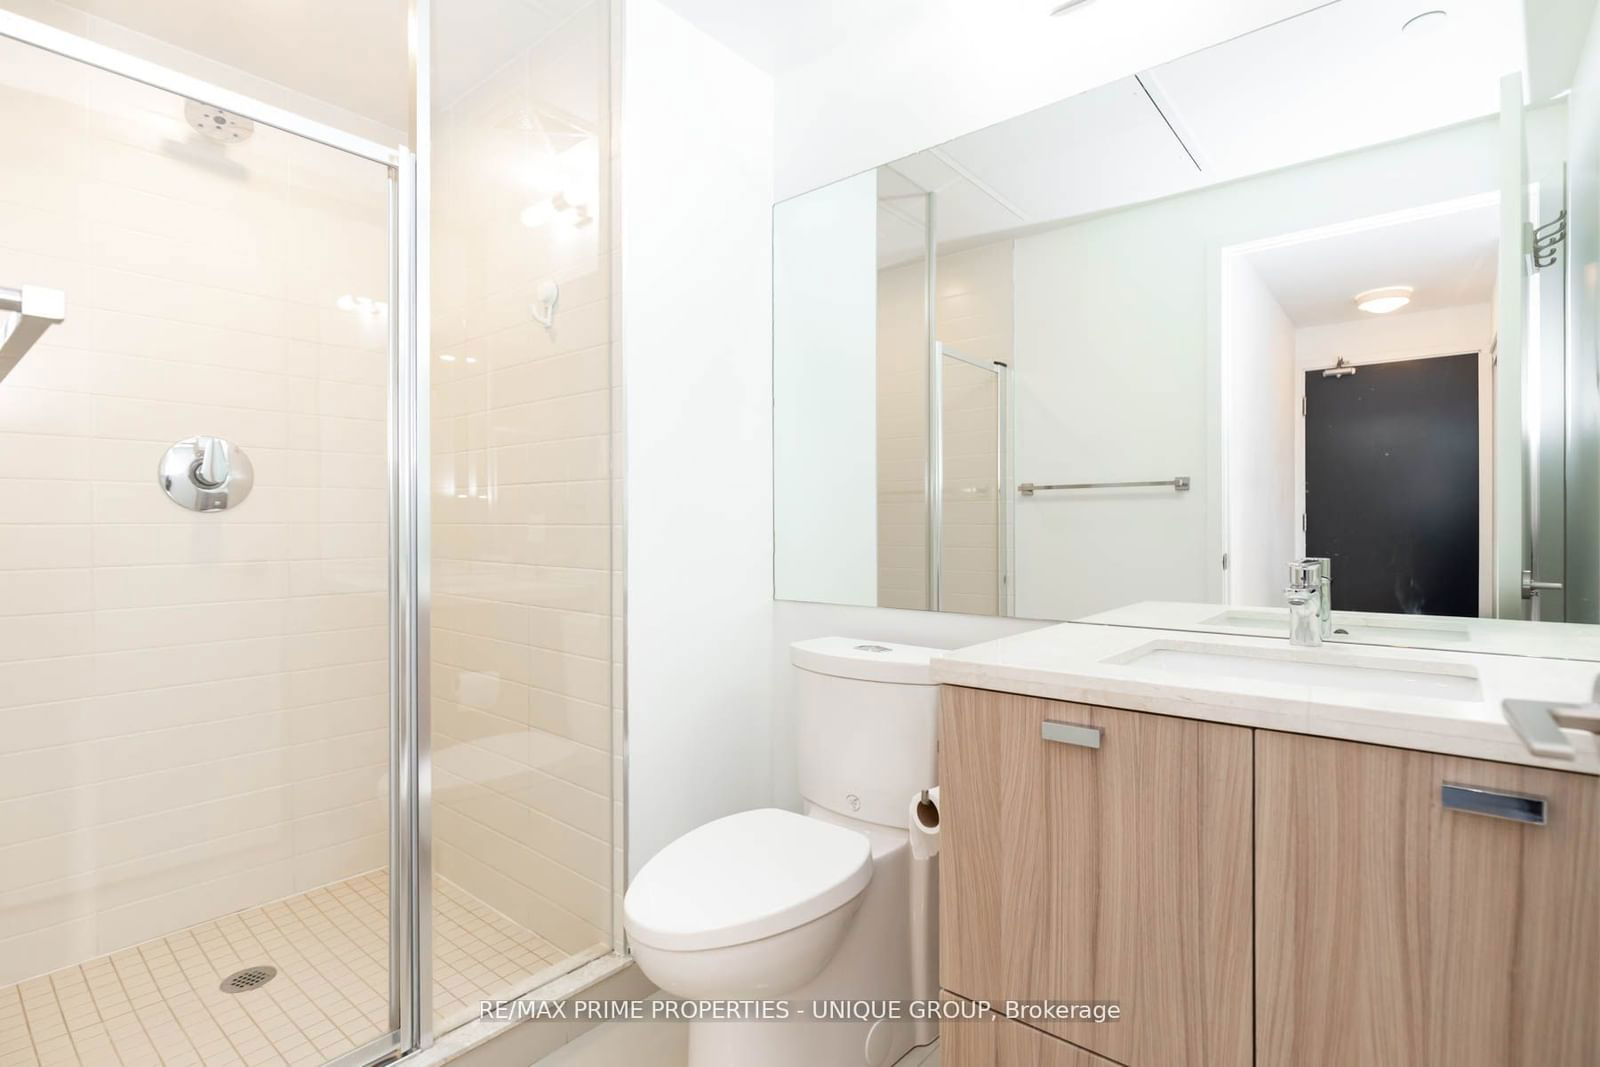
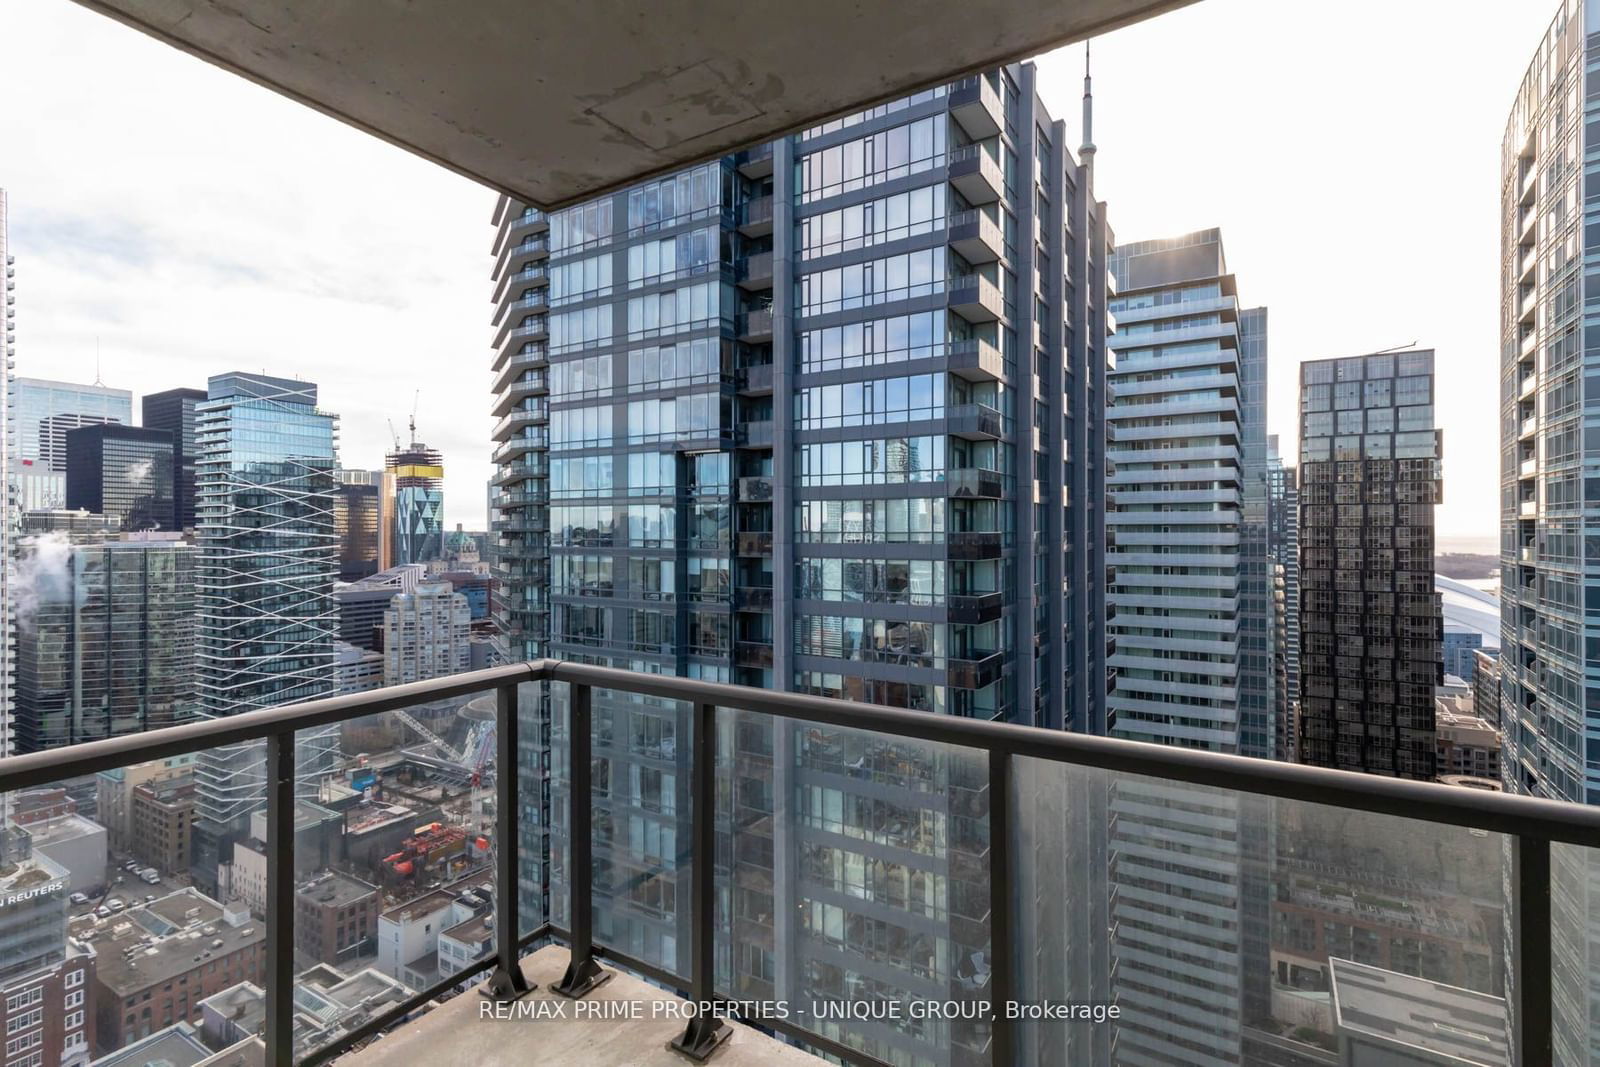
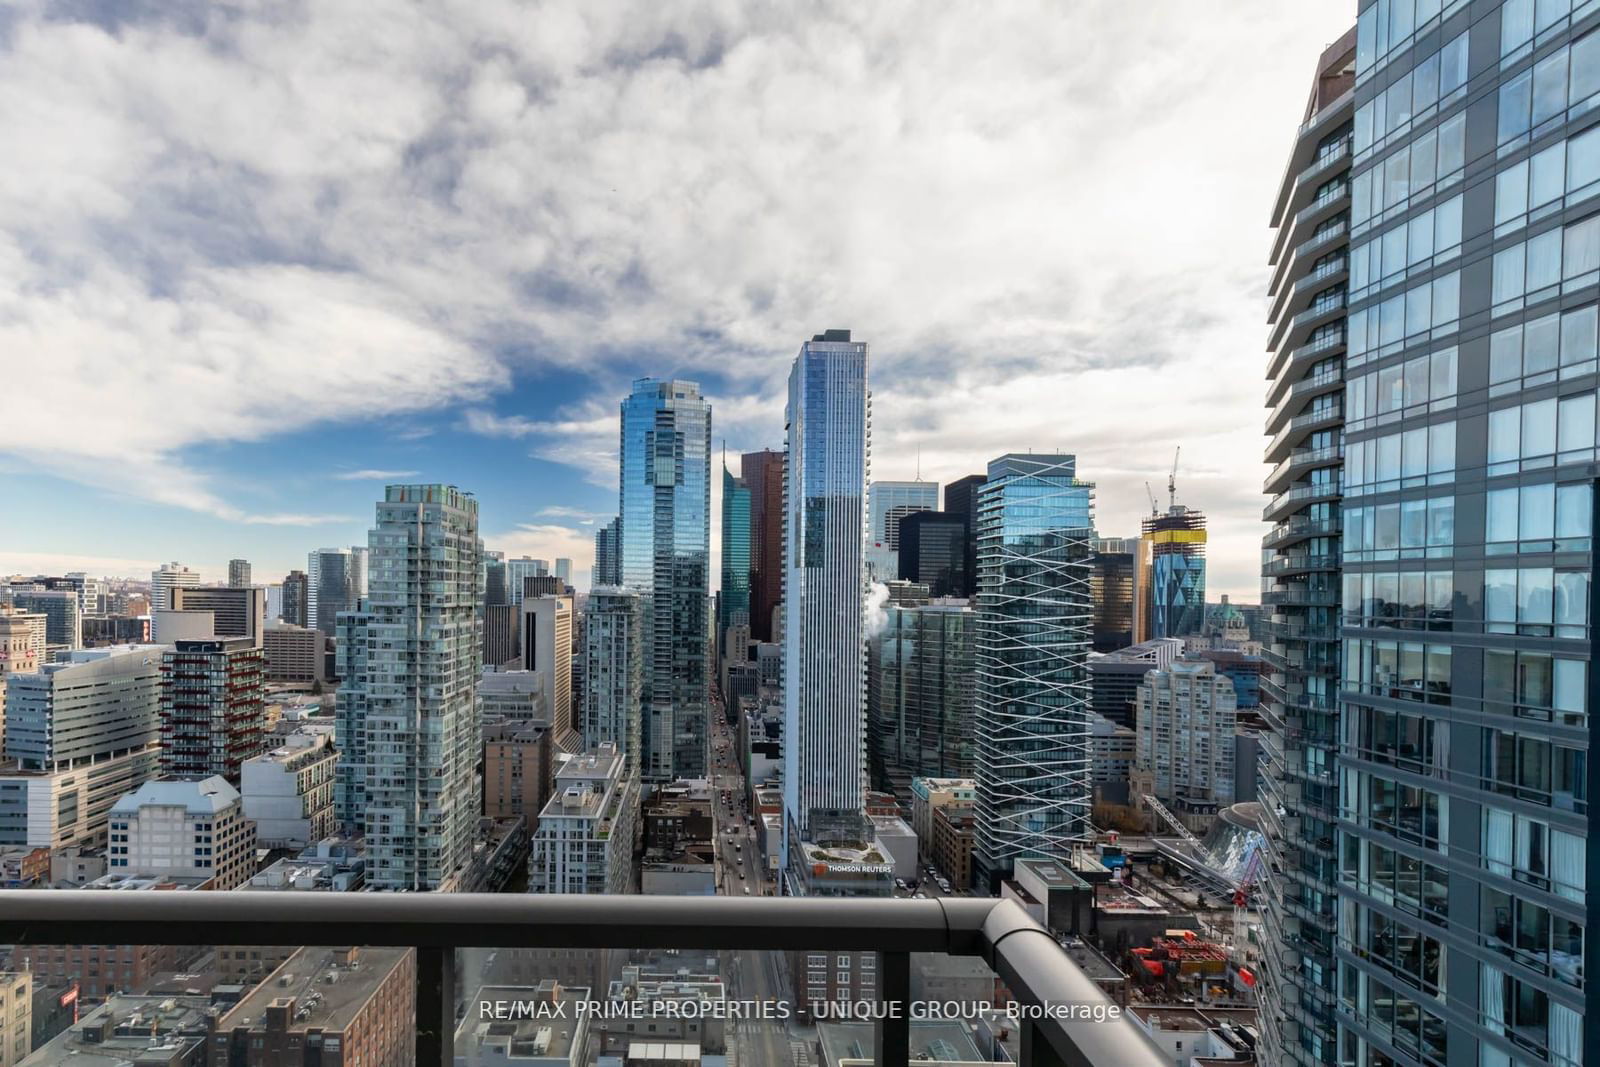
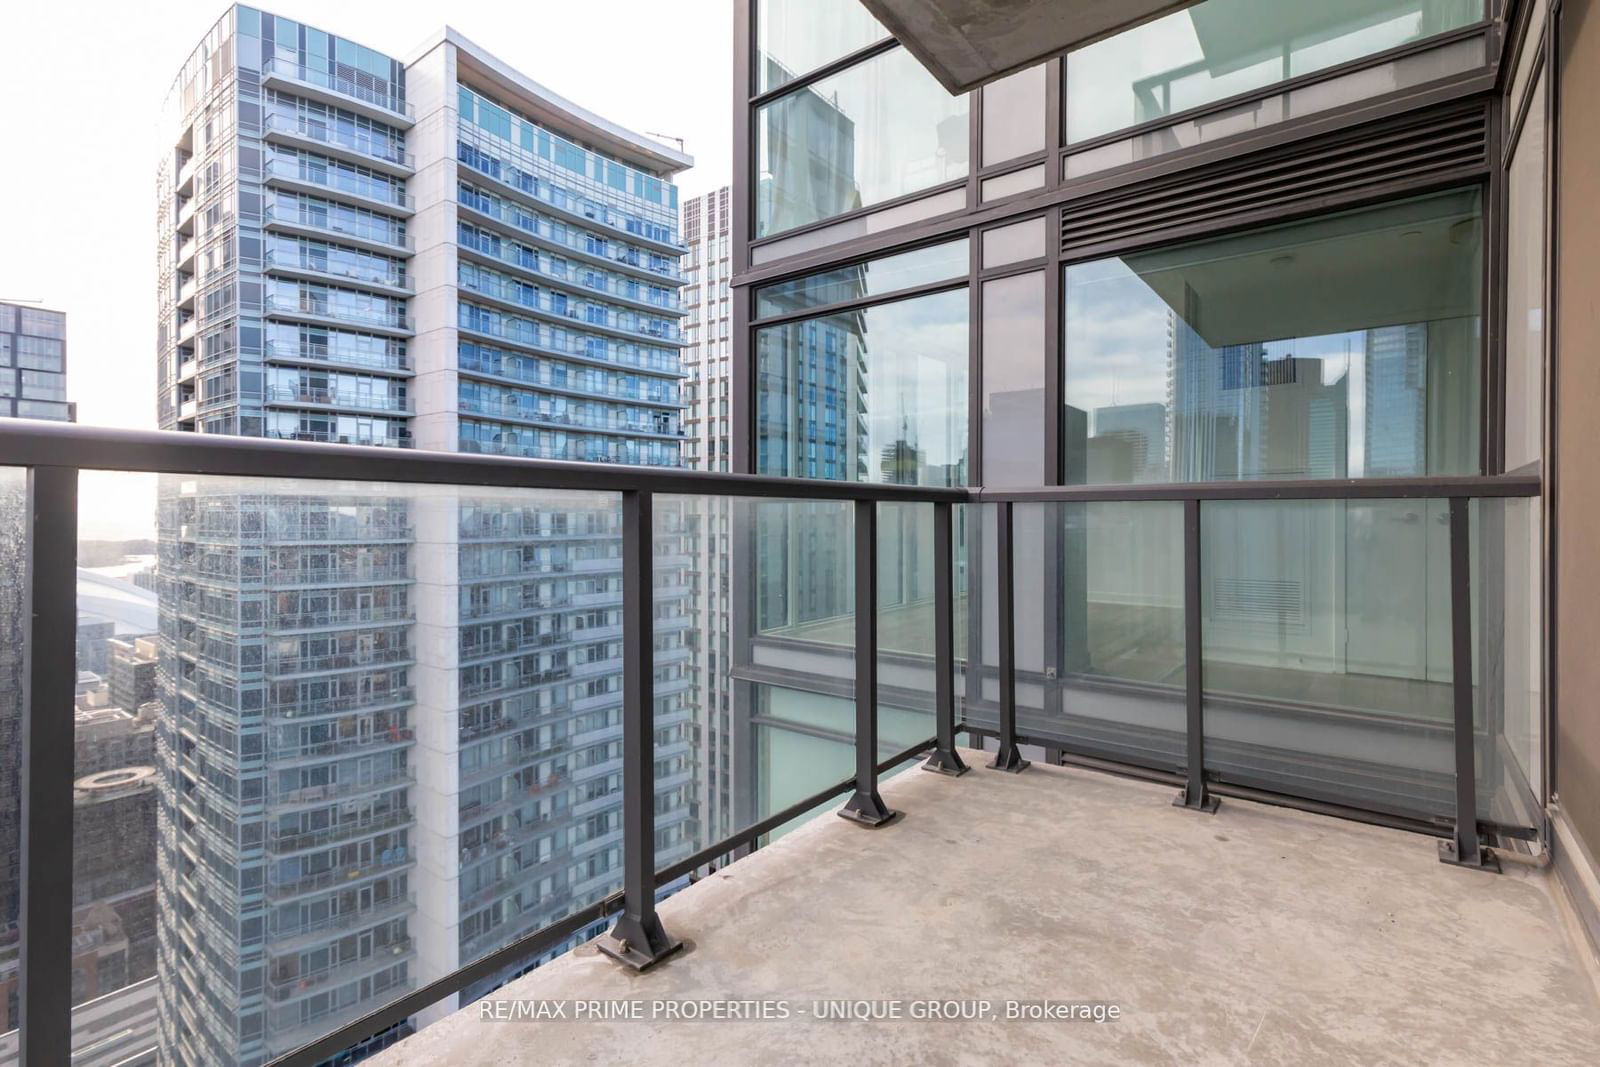
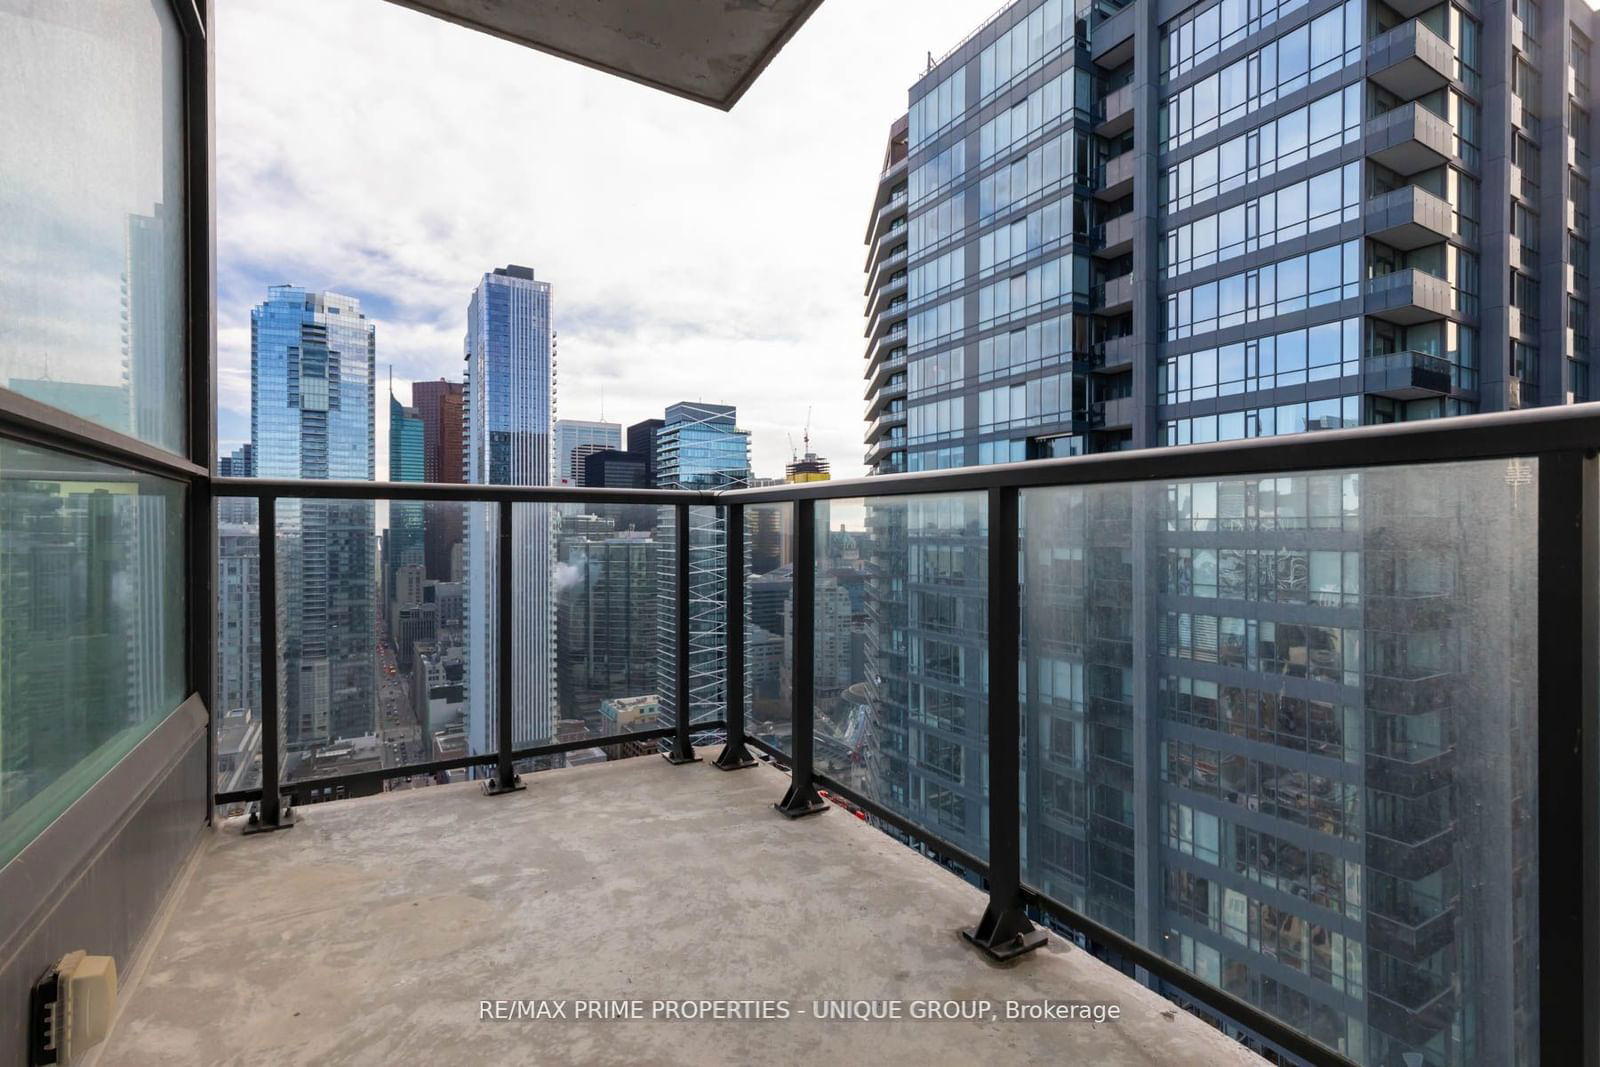
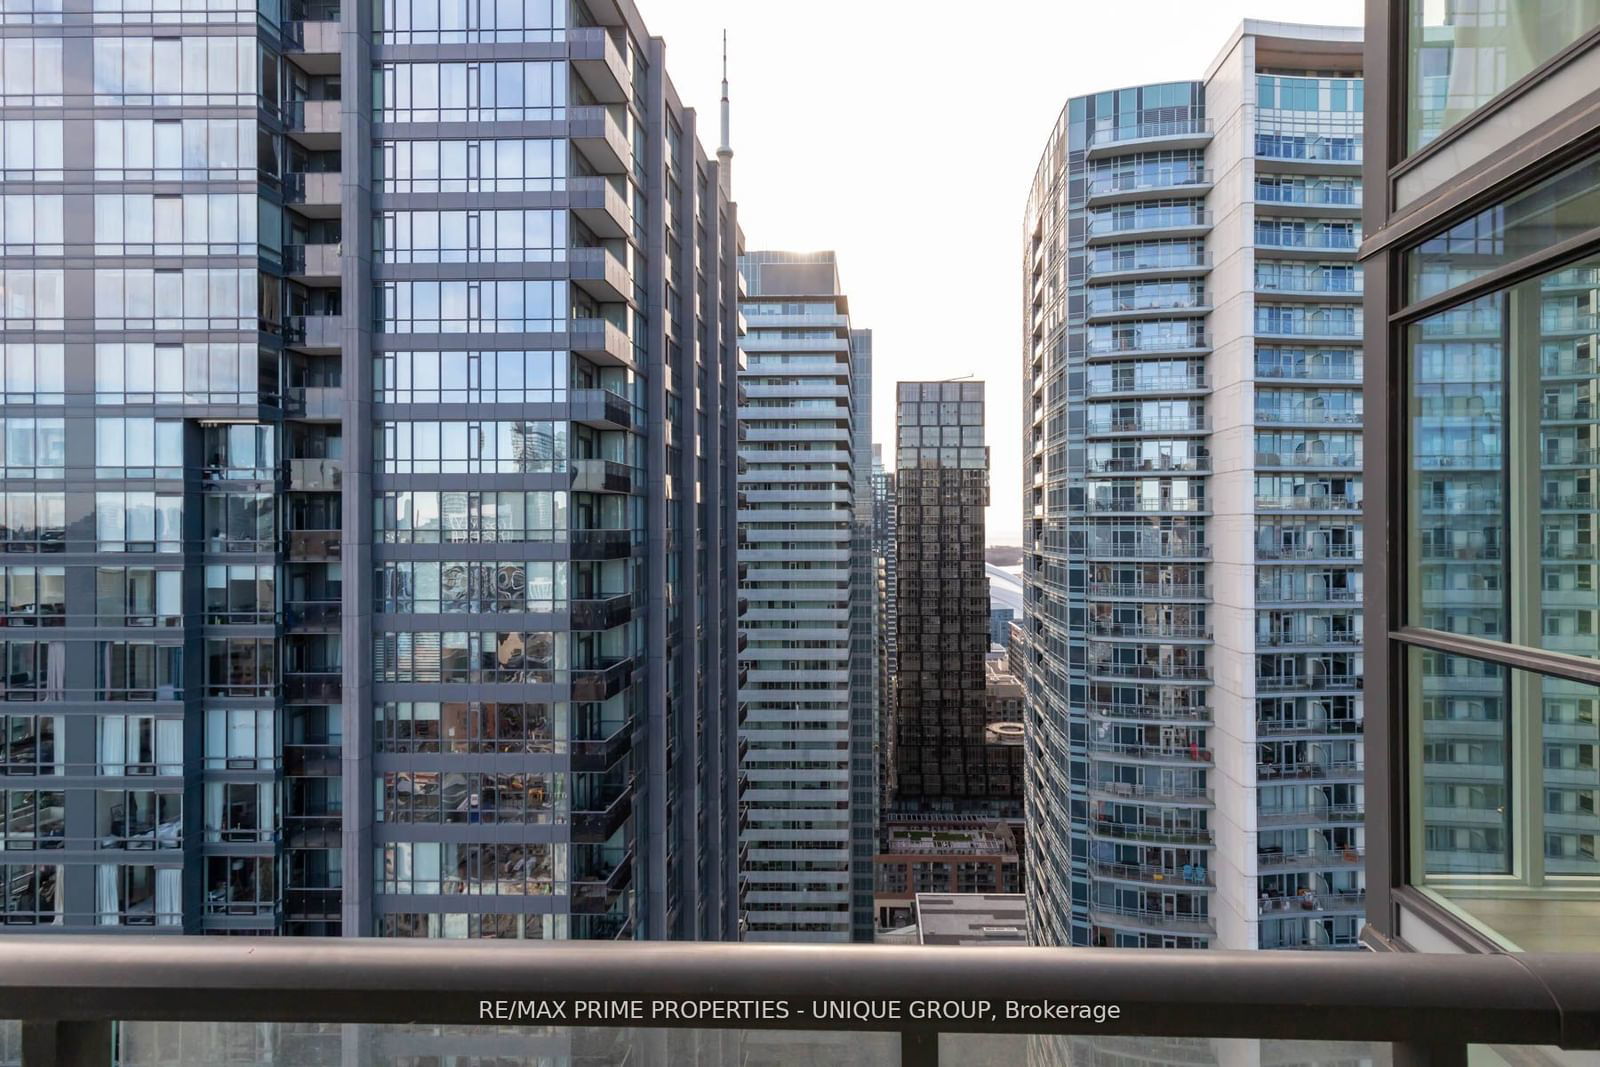
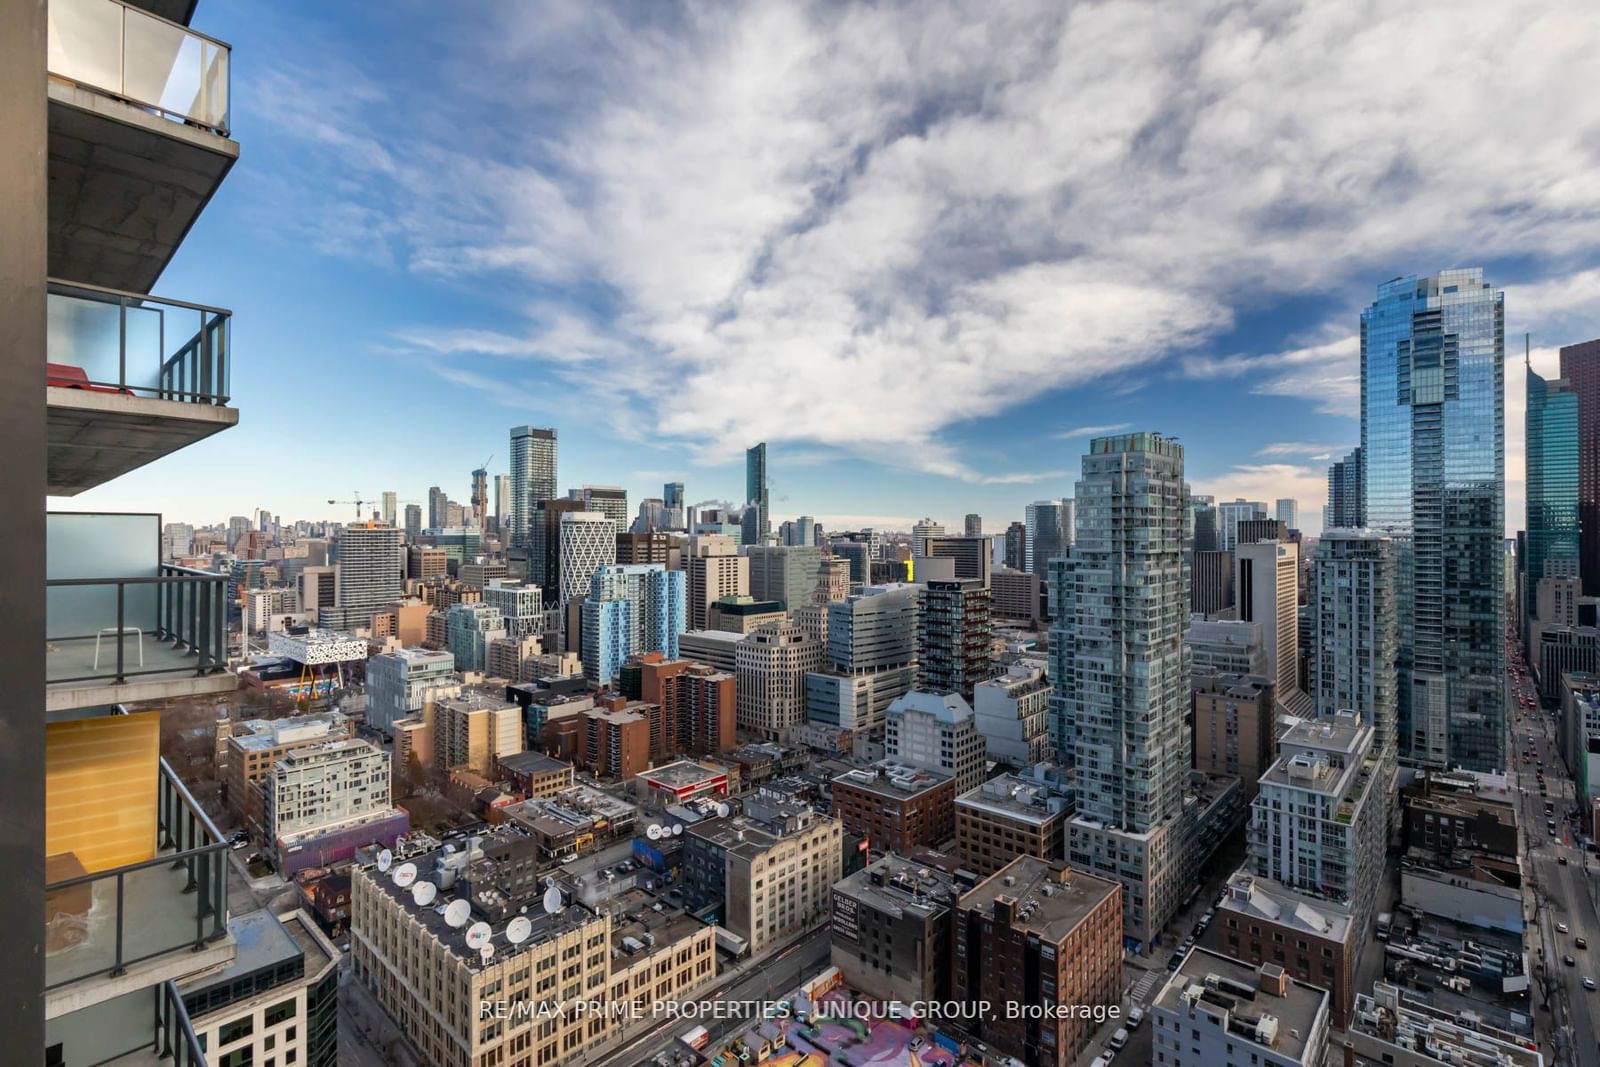
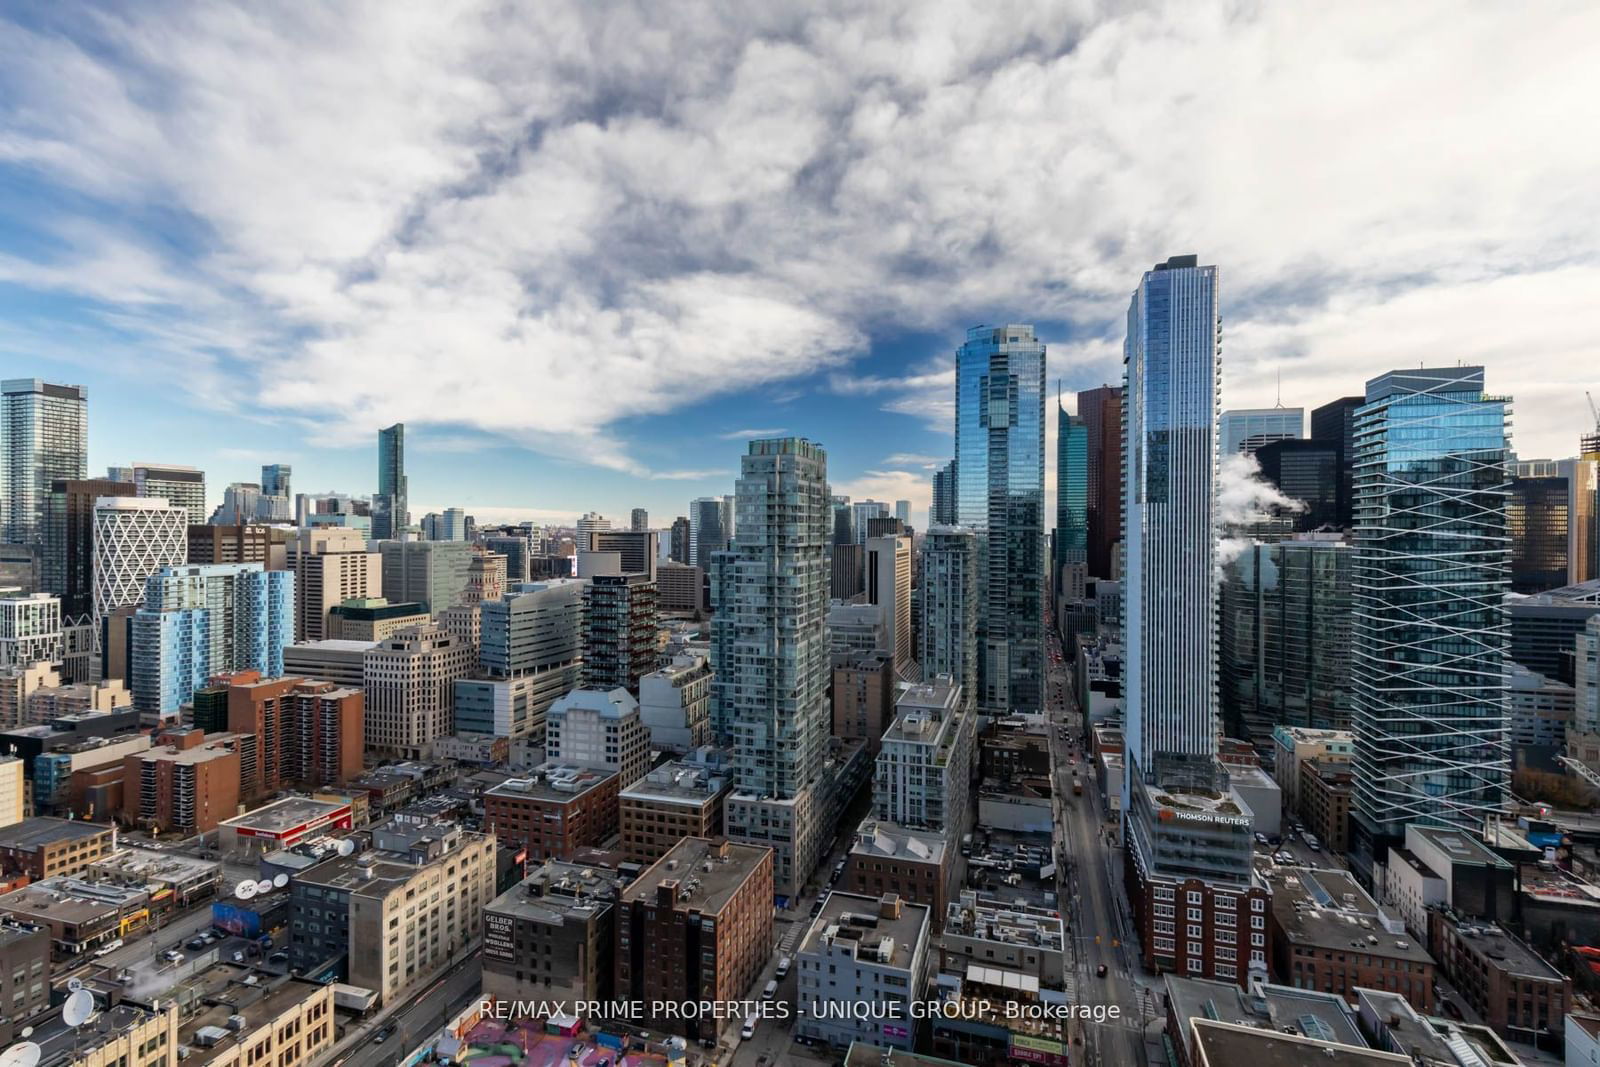
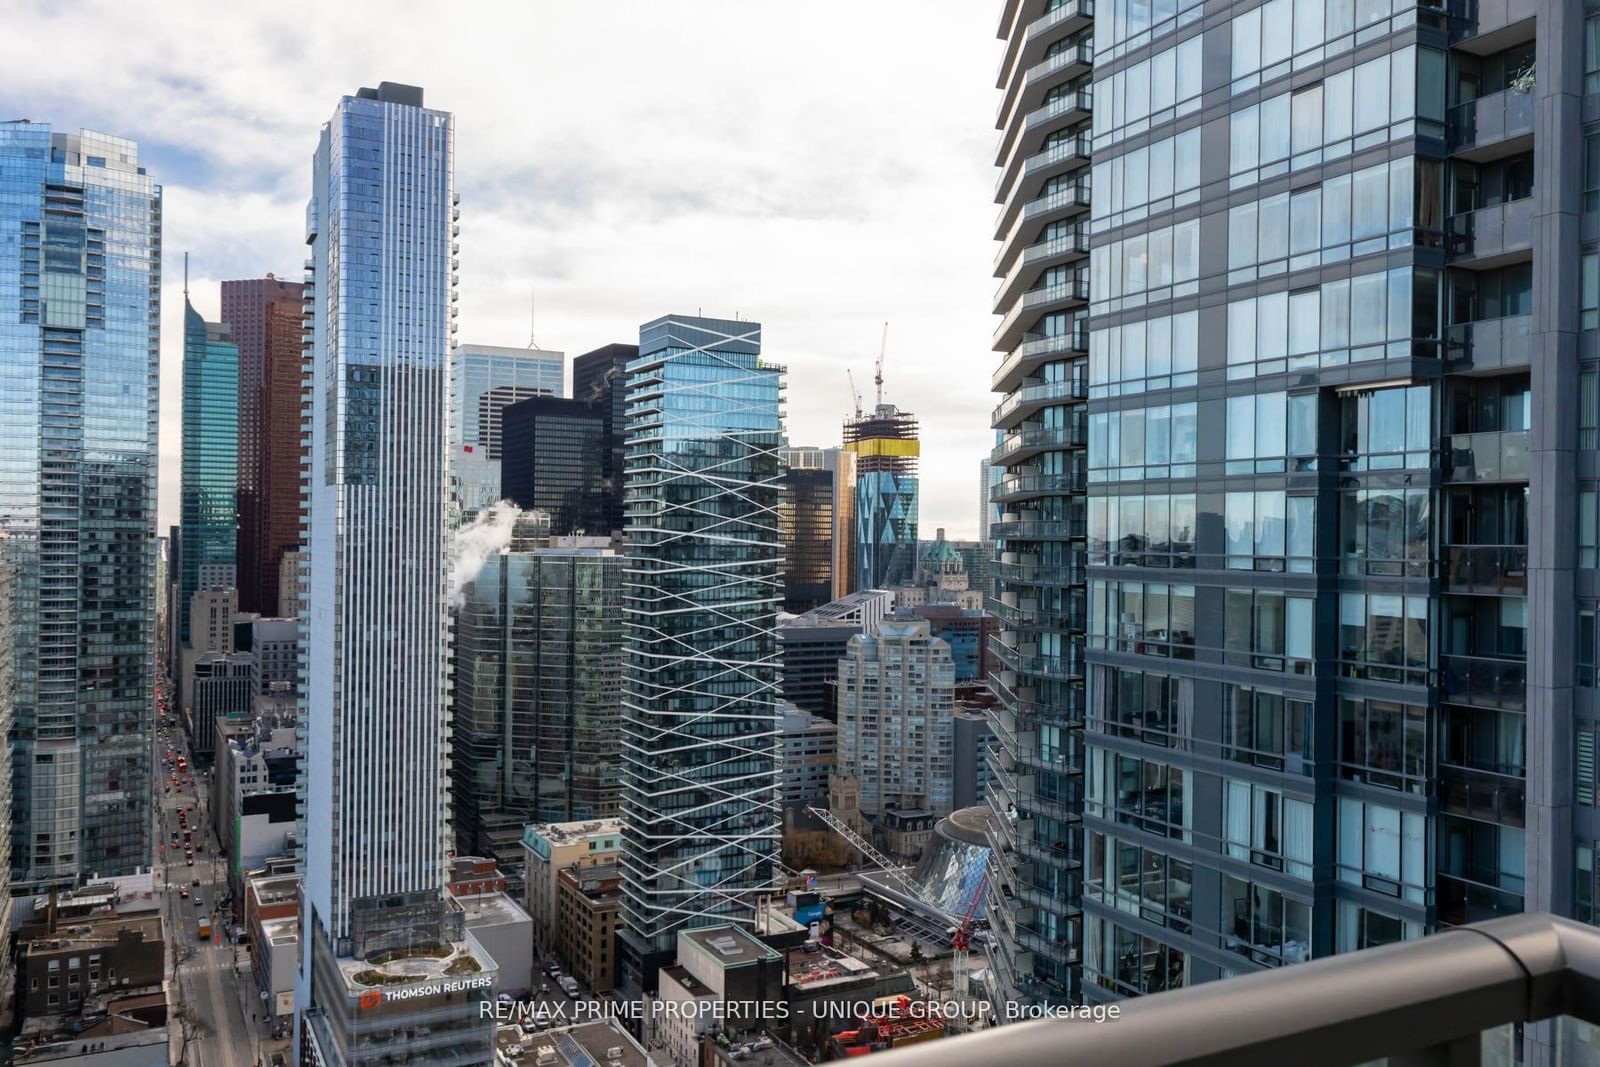
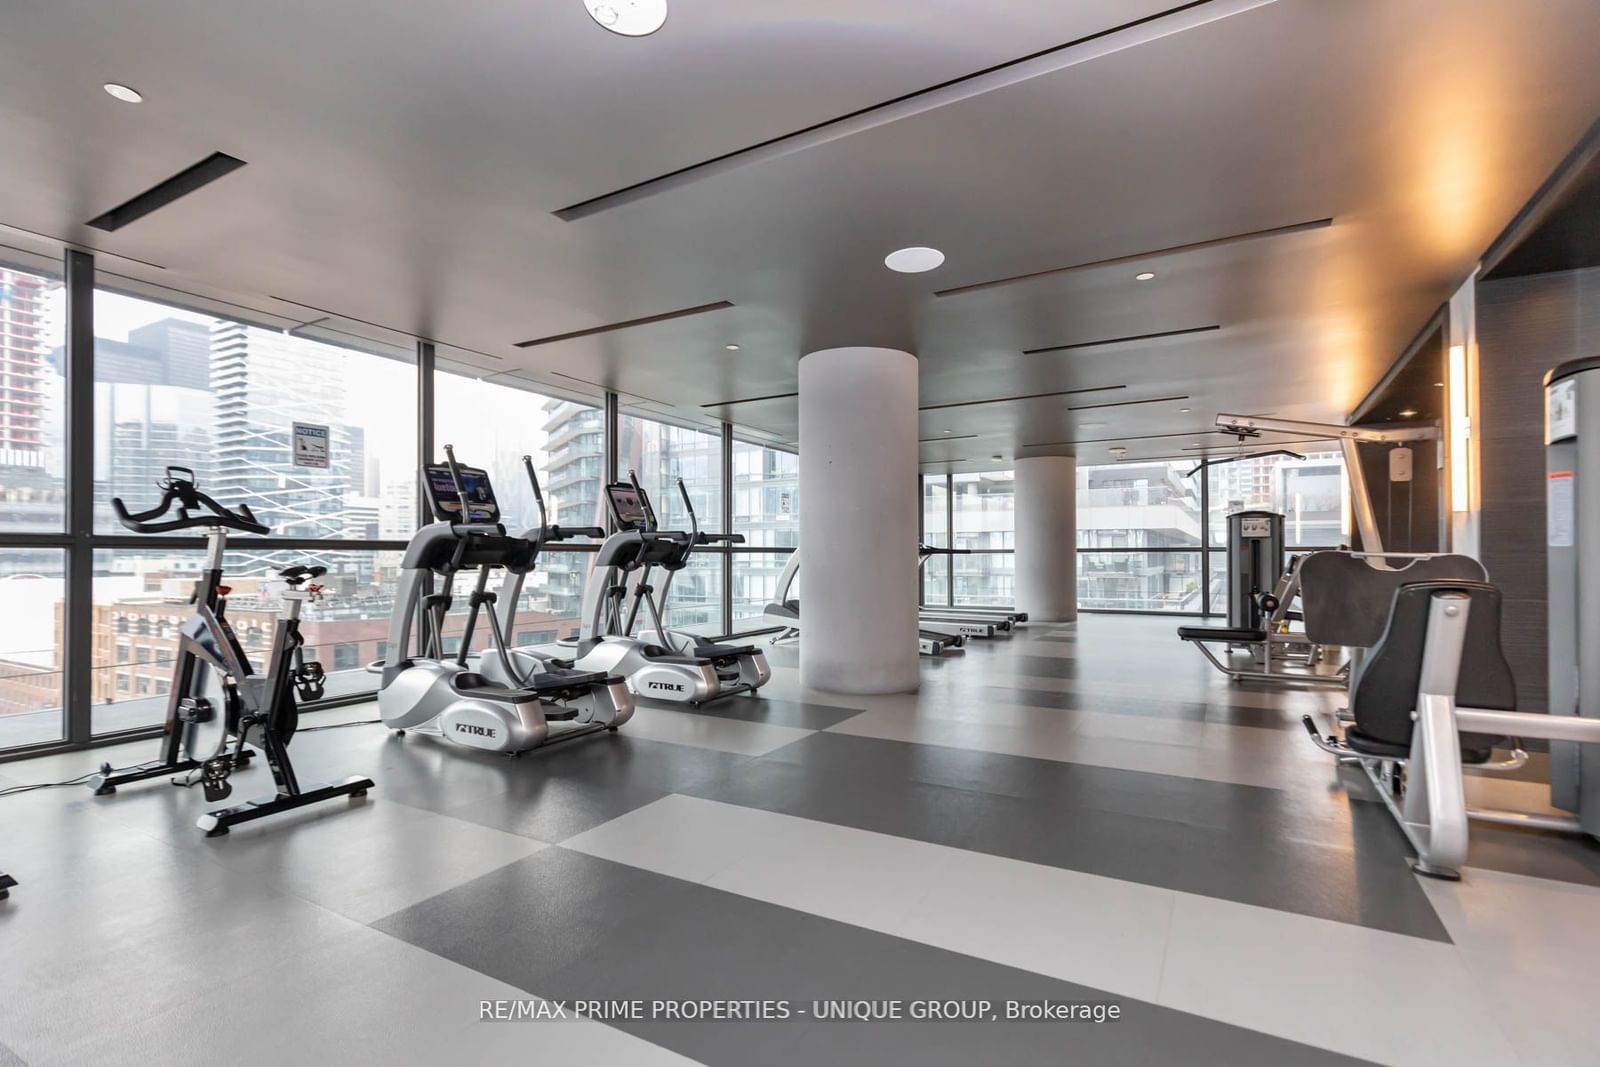
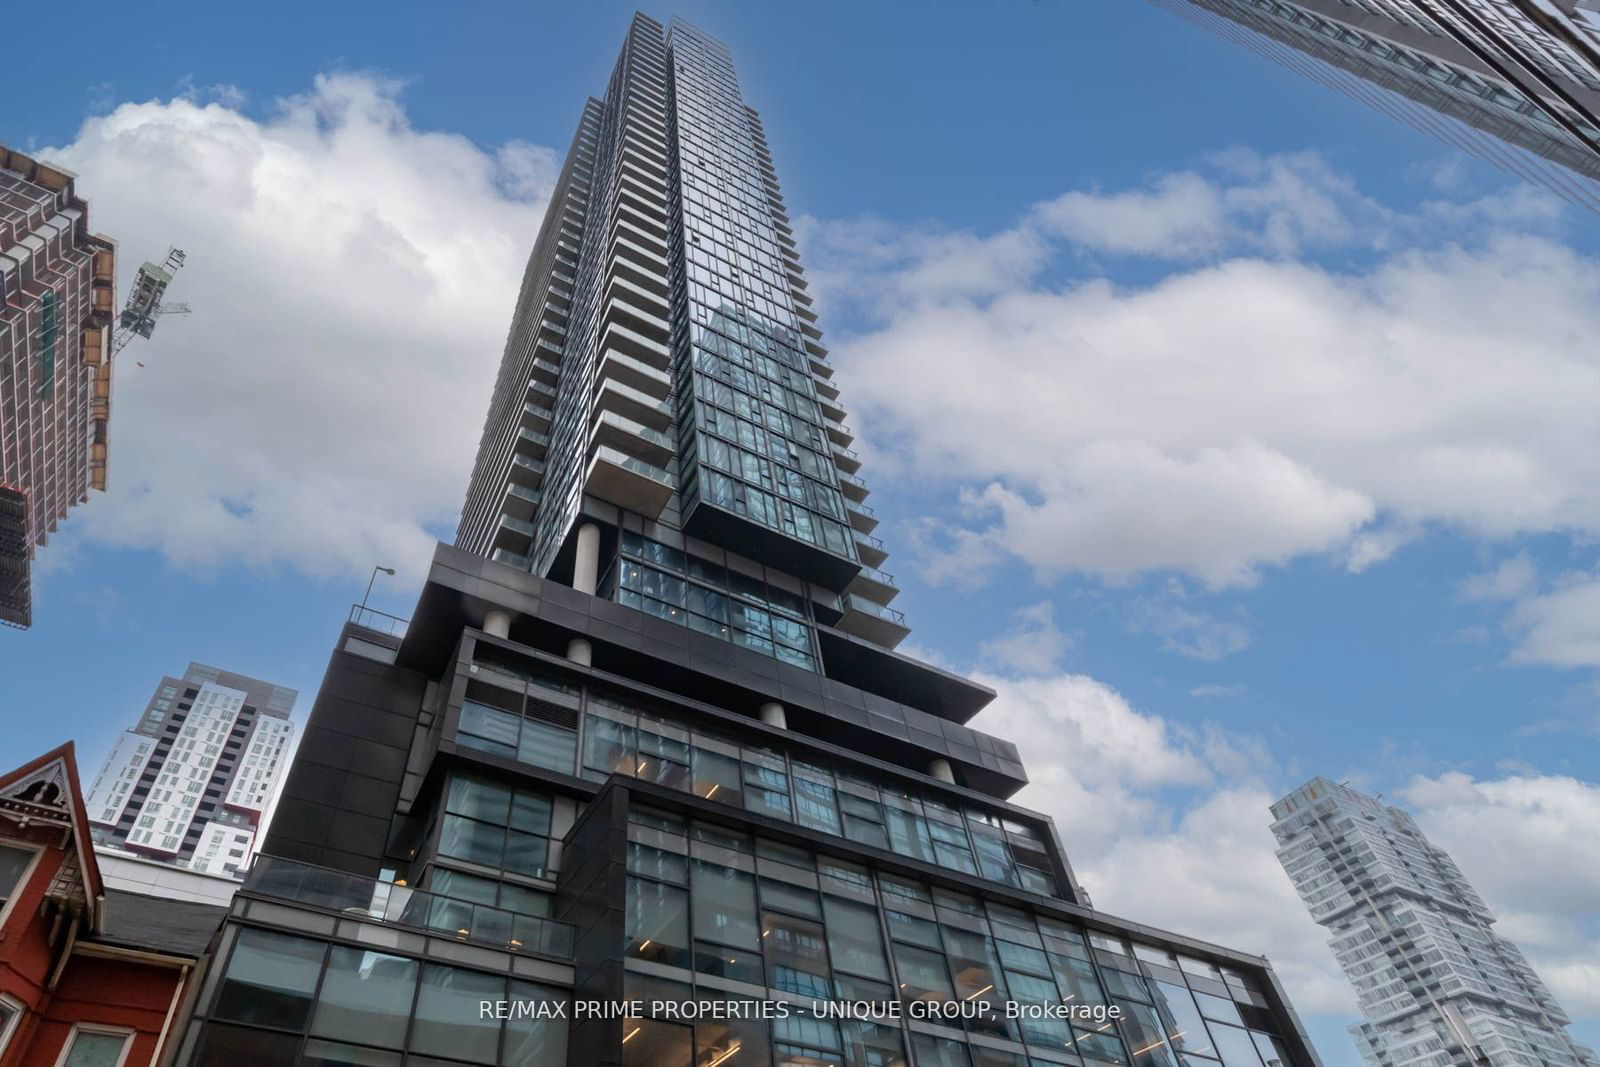
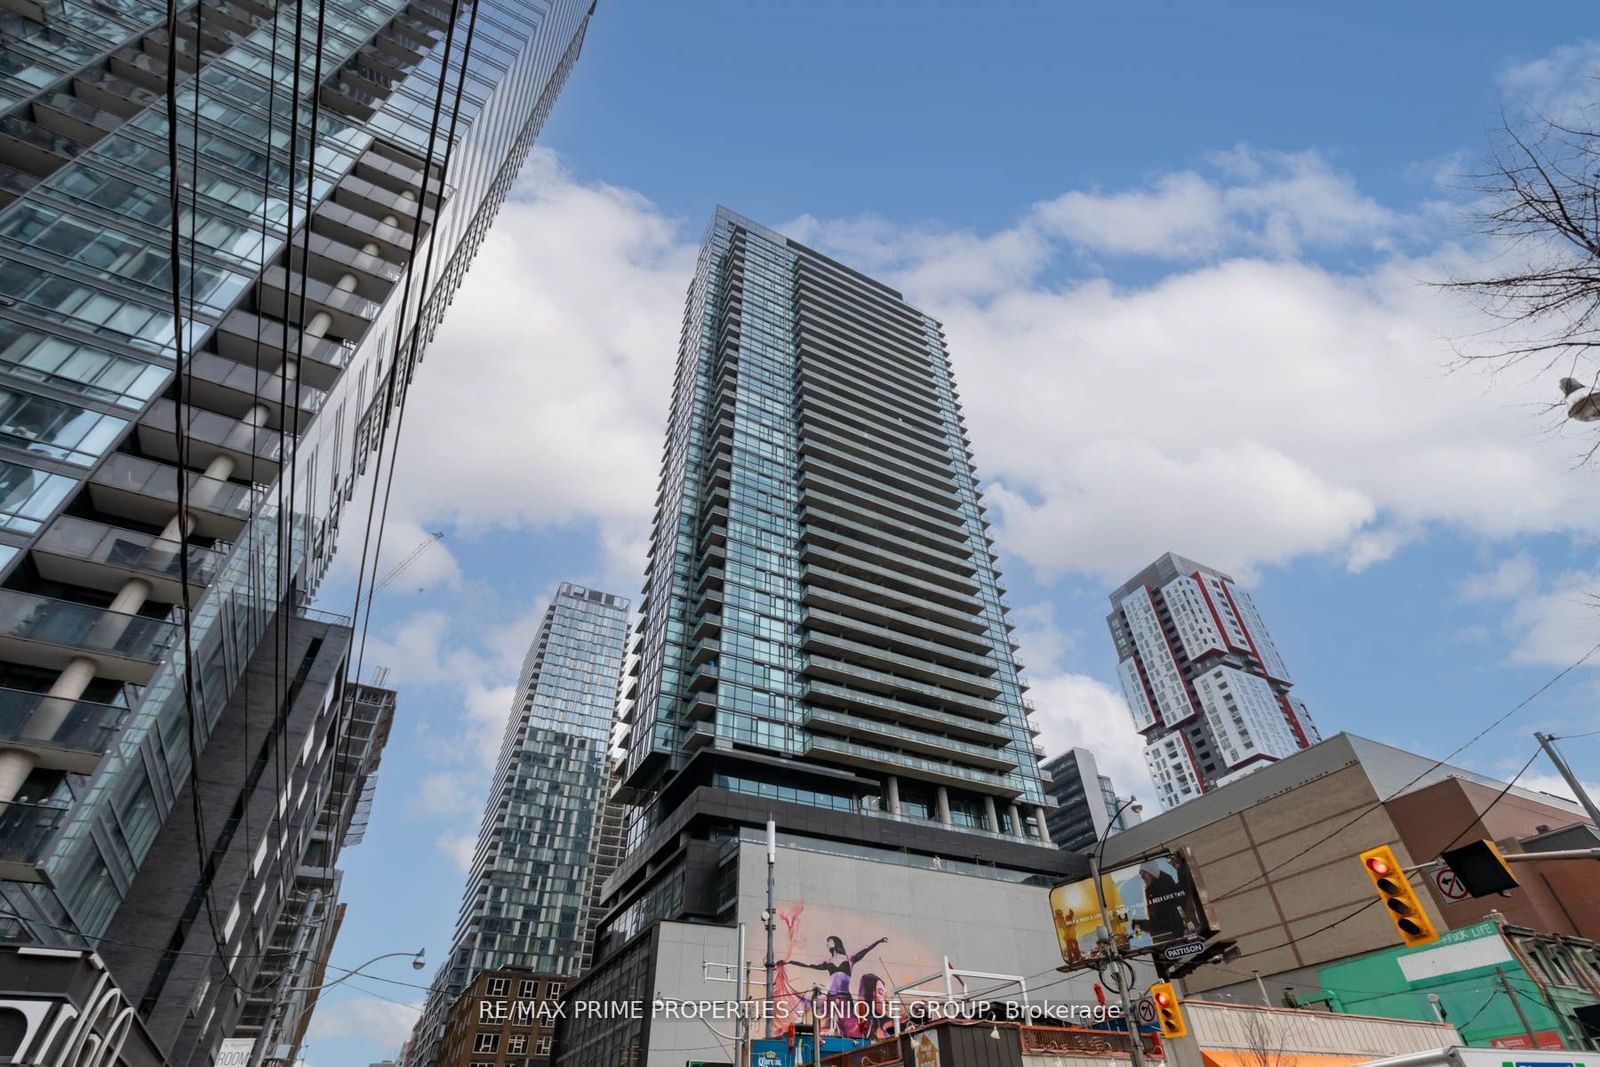
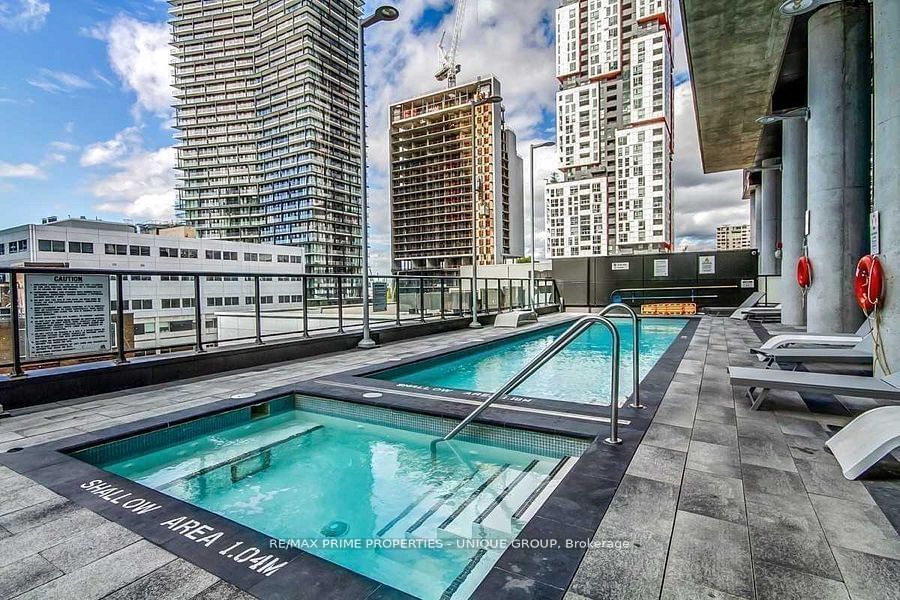
Amazing Views from this Corner Unit Two Bedroom, Two Bathroom unit with split floor-plan. Bright & Sunny, 9 Foot Ceilings, Modern Design with Floor to Ceiling Windows, in the Luxurious Bond Condo in the Heart Of Downtown Entertainment District. Facing South- East Stunning Views Of The City. Steps From TTC, Subway, Restaurants, Shops, Tiff. Amenities Incl: Outdoor Pool & Fitness Retreat, Large Gym W/Yoga Studio, Hot Tub W/Lounging Area, Bbq Lounge, Party Room, Golf Simulator, Billiards Room.
ExtrasThe Bond is a Professionally Managed Building w/ Superior Entertainment Facilities Including A Well Equipped Gym & Fitness Centre, Indoor Golf, Billiards, Outdoor Pool and More.
re/max prime properties - unique groupMLS® #C11911540
Amenities
Explore Neighbourhood
Similar Listings
Demographics
Based on the dissemination area as defined by Statistics Canada. A dissemination area contains, on average, approximately 200 – 400 households.
Price Trends
Maintenance Fees
Building Trends At The Bond Condos
Days on Strata
List vs Selling Price
Offer Competition
Turnover of Units
Property Value
Price Ranking
Sold Units
Rented Units
Best Value Rank
Appreciation Rank
Rental Yield
High Demand
Transaction Insights at 290 Adelaide Street W
| Studio | 1 Bed | 1 Bed + Den | 2 Bed | 2 Bed + Den | 3 Bed | 3 Bed + Den | |
|---|---|---|---|---|---|---|---|
| Price Range | $445,000 | $520,000 - $559,900 | $625,000 - $758,000 | $742,000 - $880,000 | No Data | No Data | No Data |
| Avg. Cost Per Sqft | $1,335 | $1,273 | $1,209 | $1,117 | No Data | No Data | No Data |
| Price Range | $1,850 - $2,200 | $2,150 - $2,500 | $2,450 - $3,300 | $2,800 - $4,150 | $3,400 - $4,000 | $4,000 | No Data |
| Avg. Wait for Unit Availability | 161 Days | 54 Days | 58 Days | 55 Days | 315 Days | No Data | No Data |
| Avg. Wait for Unit Availability | 37 Days | 11 Days | 19 Days | 17 Days | 137 Days | 514 Days | No Data |
| Ratio of Units in Building | 9% | 36% | 23% | 29% | 4% | 2% | 1% |
Transactions vs Inventory
Total number of units listed and leased in Queen West
